
We read your photo as:
Sketch the graphs of y = Sin x and y = pi/2 - 2x for 0 <= x <= pi/2 on the same axis
Mathematics
ScanSolve AI Answer
Step-by-step solution
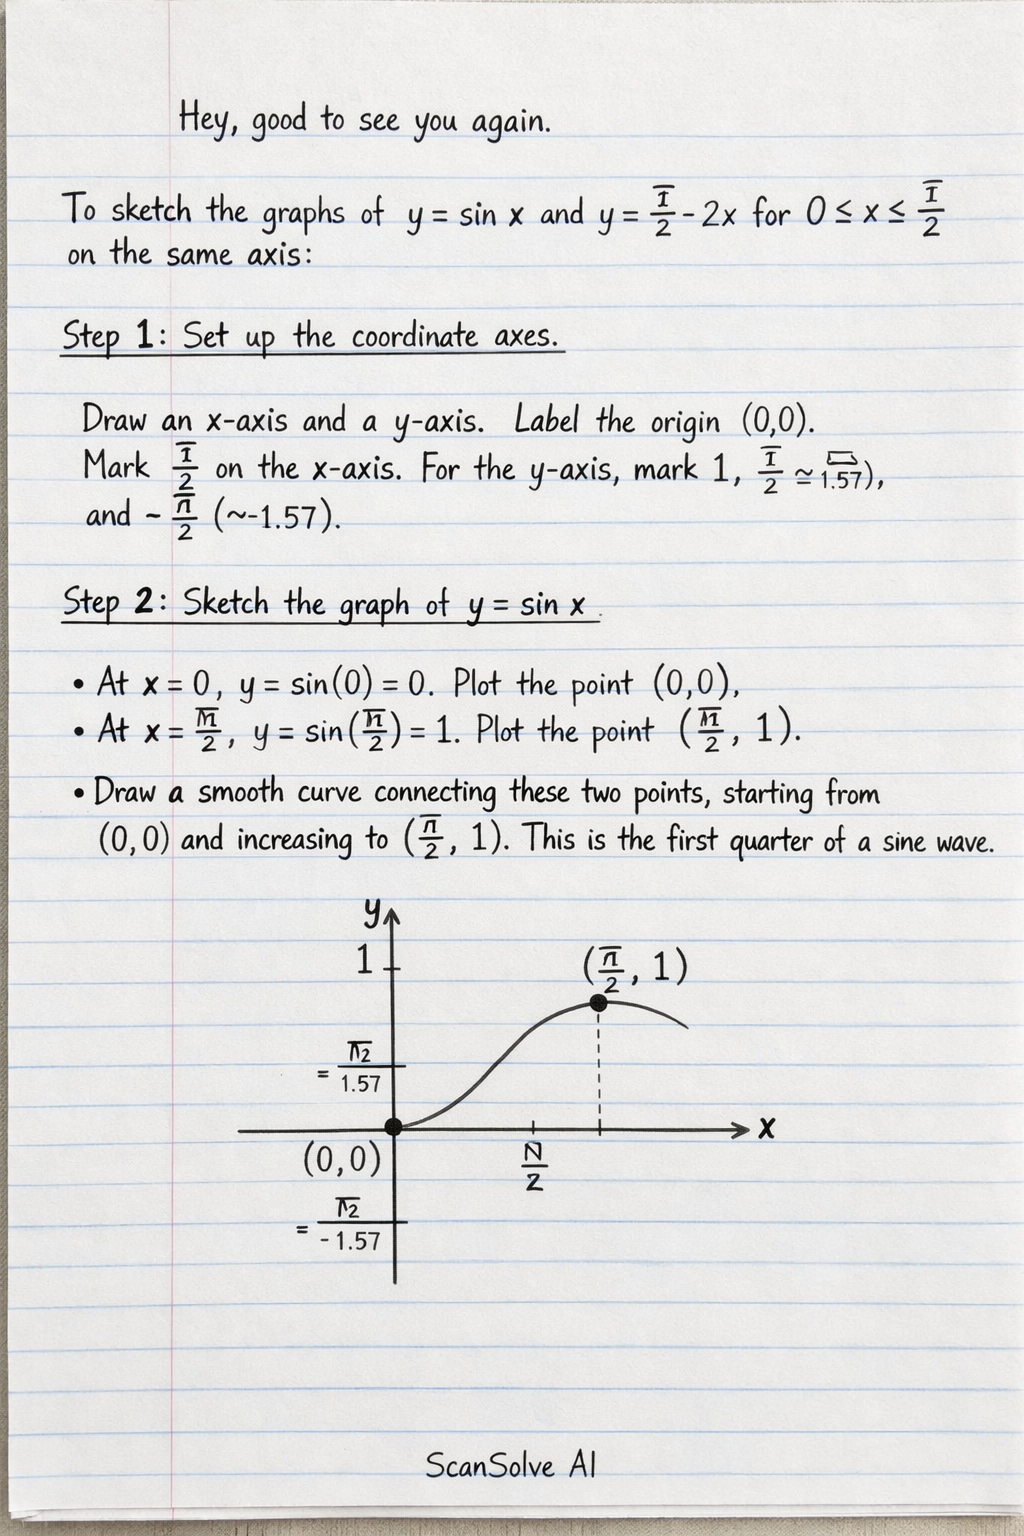
3 stepsTo sketch the graphs of and for on the same axis:
Set up the coordinate axes.
Draw an x-axis and a y-axis. Label the origin . Mark on the x-axis. For the y-axis, mark 1, (approximately 1.57), and (approximately ).
Sketch the graph of .
- At , . Plot the point .
- At , . Plot the point .
- Draw a smooth curve connecting these two points, starting from and increasing to . This is the first quarter of a sine wave.
Sketch the graph of .
This is a straight line.
- At , . Plot the point .
- At , . Plot the point .
- Draw a straight line connecting these two points: and .
The sketch will show the sine curve starting at the origin and rising to , and a straight line starting at on the y-axis and descending to on the x-axis. The two graphs will intersect at some point within the interval .
Was this helpful?
Still stuck on this one?
Ask a follow-up, and the answer starts from this question.
Got a different question?Ask your own question
More Mathematics Questions
QSketch the graph of trigonometry.you sketch itQA) Draw the graph of the functions of y= (1)/(2)x and y=3 ((1)/(2)x+(pi)/(3)) on same axes for which…QComplete the table and draw the graphs for y = 2 extcos x and y = 3 extsin x for x from 0^ exto to…QGraphs of trigonometry fuctionsQDraw the following straight line graphs on a Cartesian Plane.
Browse by topic:Trigonometry
Handwritten Step-by-Step Solution
Get this as a handwritten image on WhatsApp — like a tutor wrote it for you.
Try on WhatsApp