
We read your photo as:
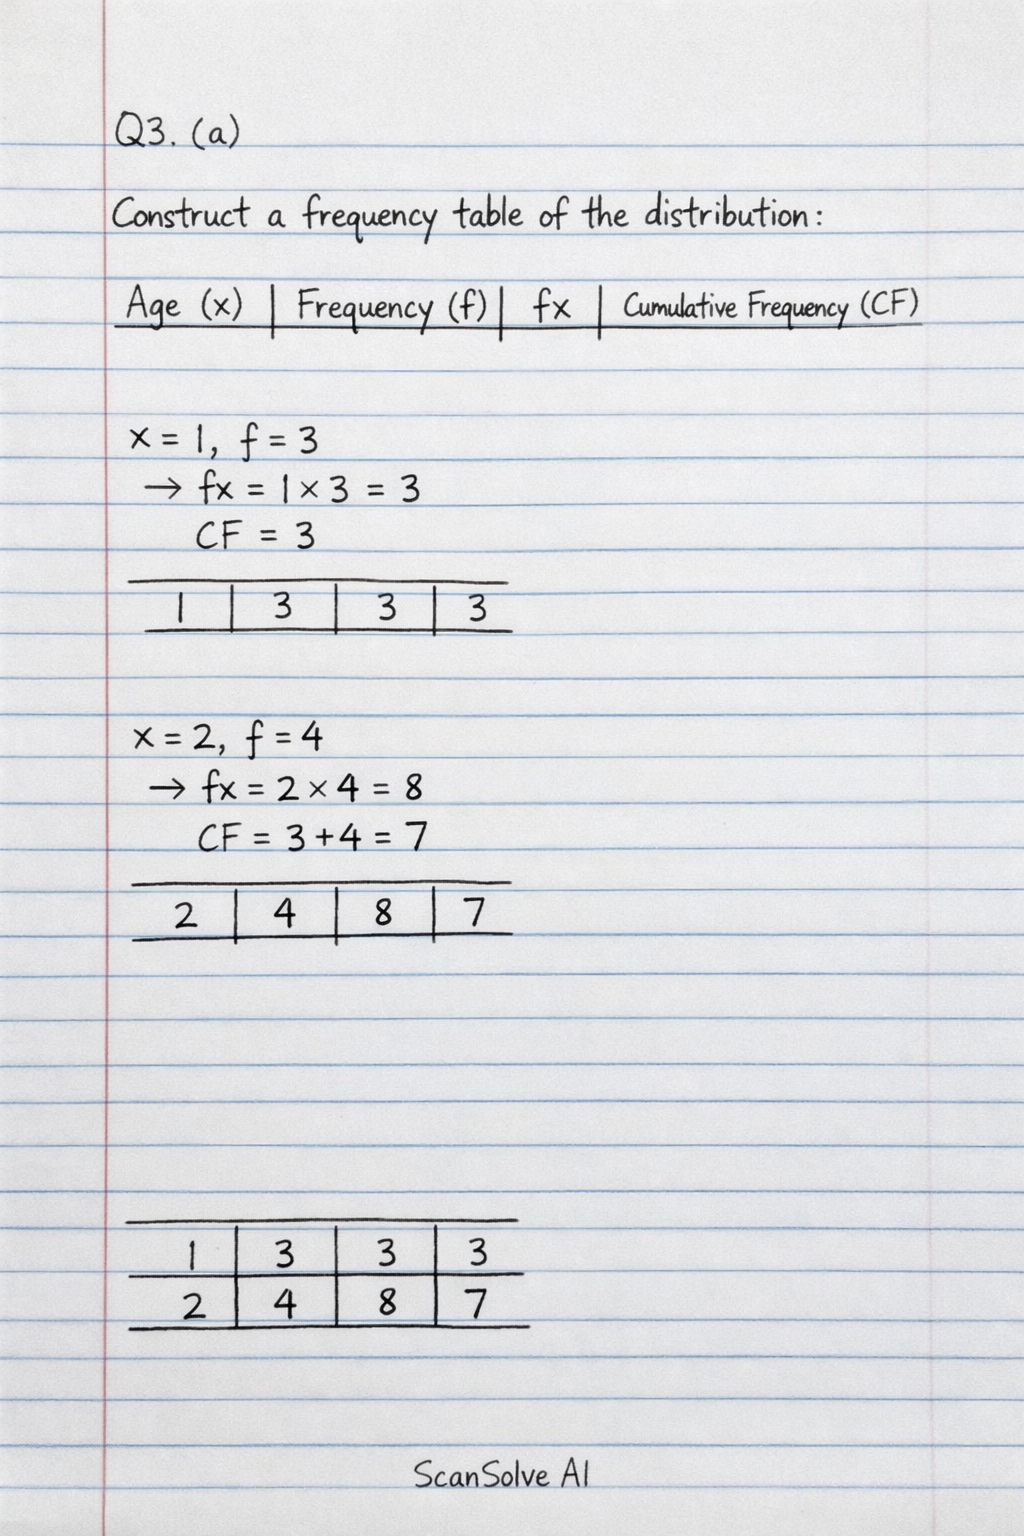
The table shows the ages of pupils and their frequencies: Ages (x): 1, 2, 3, 4, 5, 6 Frequency (f): 3, 4, 5, 1, 2, 2. Construct a frequency table of the distribution.
Mathematics
ScanSolve AI Answer
Here are the solutions to the problems:
Q3. (a)
The table shows the ages of pupils and their frequencies:
Ages (): 1, 2, 3, 4, 5, 6
Frequency (): 3, 4, 5, 1, 2, 2
i) Construct a frequency table of the distribution:
| Age () | Frequency () | Cumulative Frequency (CF) | |
|---|---|---|---|
| 1 | 3 | 3 | 3 |
| 2 | 4 | 8 | 7 |
Was this helpful?
Still stuck on this one?
Ask a follow-up, and the answer starts from this question.
Got a different question?Ask your own question
More Mathematics Questions
QThe following table shows the frequency distribution of the ages of 100 persons: Ages (in years) |…QRepresent the above data in a frequency table.QCreate a frequency distribution table for the following data points: [28, 17, 15, 22, 29, 21, 23…QOrganise this data into a frequency distribution table. Data: 5, 5, 5, 5, 5, 10, 10, 10, 10, 10, 15…QThe following is record of scores obtained 30 J.H.S. 2 pupils in a test marked out of 5: 5, 4, 3, 1…
Browse by topic:Statistics
Handwritten Step-by-Step Solution
Get this as a handwritten image on WhatsApp — like a tutor wrote it for you.
Try on WhatsApp