Use the above table to find the missing values , beta, alpha, lambda and theta

Mathematics
Use the above table to find the missing values , beta, alpha, lambda and theta

ScanSolve AI Answer

Answer

46117.500

Here are the solutions for the problems.

: ANOVA Table

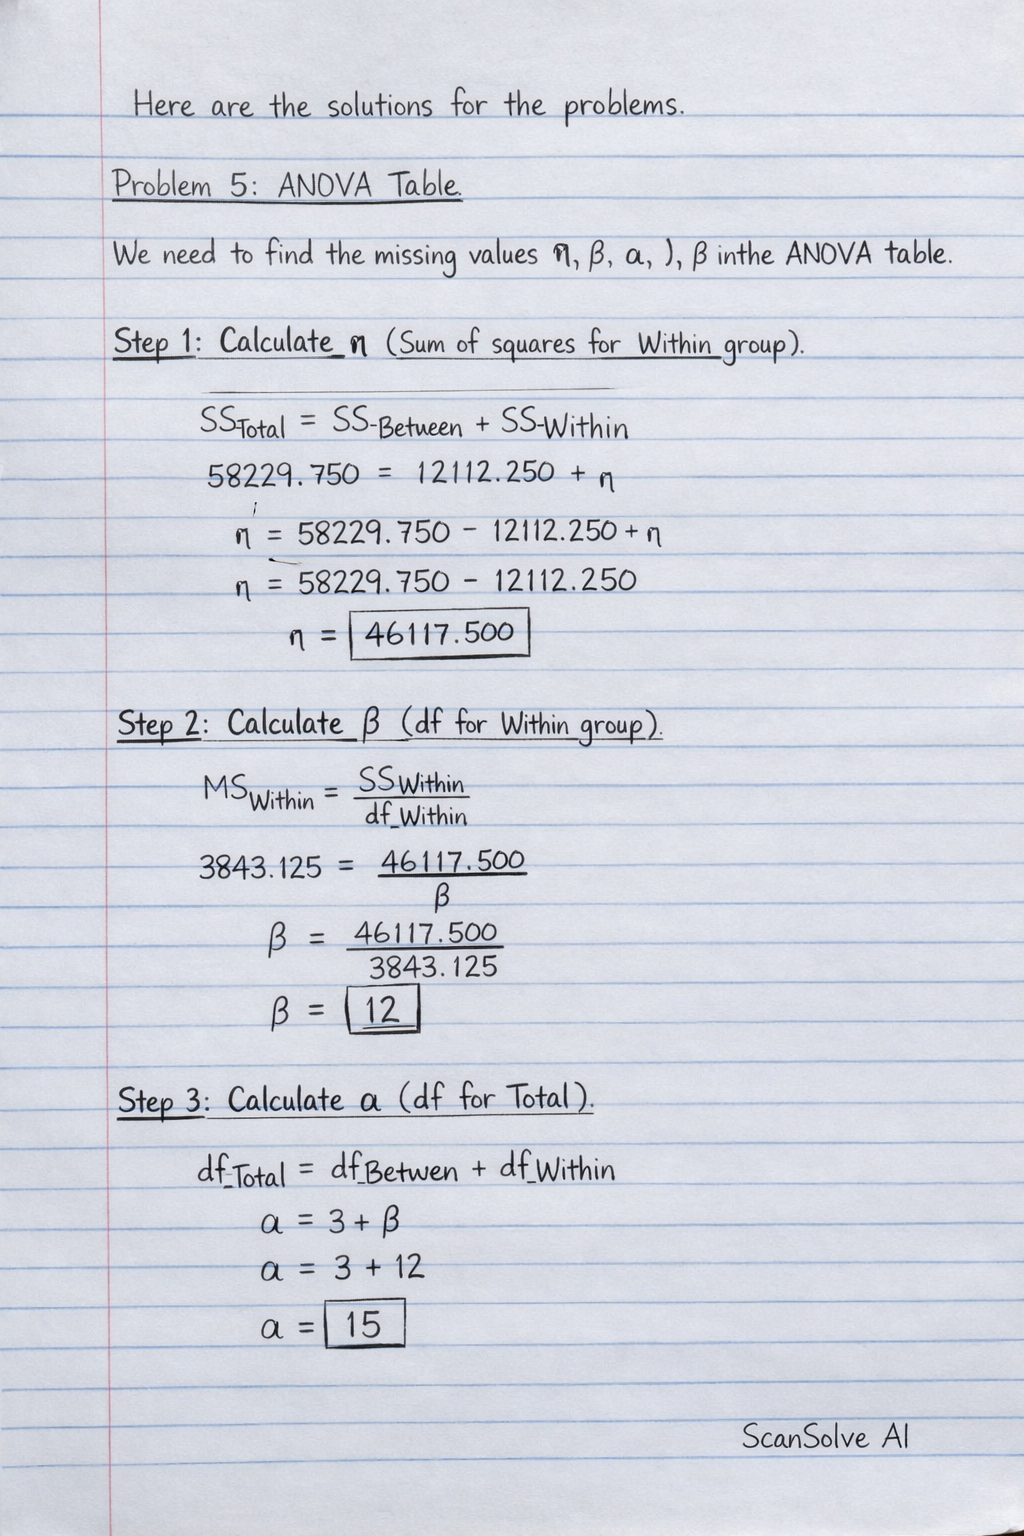
We need to find the missing values η,β,α,λ,θ\eta, \beta, \alpha, \lambda, \theta in the ANOVA table.

Step 1: Calculate η\eta (Sum of squares for Within group). The total sum of squares is the sum of the sum of squares for "Source of starch" and "Within group". SSTotal=SSBetween+SSWithinSS_{Total} = SS_{Between} + SS_{Within} 58229.750=12112.250+η58229.750 = 12112.250 + \eta η=58229.75012112.250\eta = 58229.750 - 12112.250 η=46117.500\eta = \boxed{46117.500}

Step 2: Calculate β\beta (df for Within group). Mean Square (MS) is calculated as Sum of Squares (SS) divided by df. MSWithin=SSWithindfWithinMS_{Within} = \frac{SS_{Within}}{df_{Within}} 3843.125=ηβ3843.125 = \frac{\eta}{\beta} 3843.125=46117.500β3843.125 = \frac{46117.500}{\beta} β=46117.5003843.125\beta = \frac{46117.500}{3843.125} β=12\beta = \boxed{12}

Step 3: Calculate α\alpha (df for Total). The total degrees of freedom is the sum of the degrees of freedom for "Source of starch" and "Within group". dfTotal=dfBetween+dfWithindf_{Total} = df_{Between} + df_{Within} α=3+β\alpha = 3 + \beta α=3+12\alpha = 3 + 12 α=15\alpha = \boxed{15}

Step 4: Calculate λ\lambda (Mean square for Source of starch). MSBetween=SSBetweendfBetweenMS_{Between} = \frac{SS_{Between}}{df_{Between}} λ=12112.2503\lambda = \frac{12112.250}{3} λ=4037.417\lambda = \boxed{4037.417} (rounded to three decimal places)

Step 5: Calculate θ\theta (F-statistic). The F-statistic is the ratio of the Mean Square for "Source of starch" to the Mean Square for "Within group". F=MSBetweenMSWithinF = \frac{MS_{Between}}{MS_{Within}} θ=λ3843.125\theta = \frac{\lambda}{3843.125} θ=4037.4173843.125\theta = \frac{4037.417}{3843.125} θ=1.051\theta = \boxed{1.051} (rounded to three decimal places)

: Hypothesis Test for Mean Breaking Strength

We are testing the hypothesis that the mean breaking strength of the fishing line is 9 kg.

Step 1: State the null and alternative hypotheses. The null hypothesis (H0H_0) is that the mean breaking strength is 9 kg. The alternative hypothesis (H1H_1) is that the mean breaking strength is not 9 kg. H0:μ=9 kgH_0: \mu = 9 \text{ kg} H1:μ9 kgH_1: \mu \neq 9 \text{ kg}

Step 2: Determine the level of significance and critical values. The level of significance is α=0.05\alpha = 0.05. Since this is a two-tailed test, we divide α\alpha by 2: α/2=0.05/2=0.025\alpha/2 = 0.05/2 = 0.025. The critical z-values for a 95% confidence level (or α=0.05\alpha=0.05) in a two-tailed test are ±1.96\pm 1.96.

Step 3: Calculate the test statistic. We use the z-test statistic because the population standard deviation (σ\sigma) is known and the sample size (nn) is large. The formula is: z=xˉμ0σ/nz = \frac{\bar{x} - \mu_0}{\sigma / \sqrt{n}} Given: Sample mean (xˉ\bar{x}) = 10 kg Hypothesized population mean (μ0\mu_0) = 9 kg Population standard deviation (σ\sigma) = 0.5 kg Sample size (nn) = 50 z=1090.5/50z = \frac{10 - 9}{0.5 / \sqrt{50}} z=10.5/7.0710678z = \frac{1}{0.5 / 7.0710678} z=10.070710678z = \frac{1}{0.070710678} z14.142z \approx \boxed{14.142}

Step 4: Make a decision. Compare the calculated z-statistic to the critical values. The calculated z-statistic is 14.14214.142. The critical z-values are ±1.96\pm 1.96. Since 14.142>1.9614.142 > 1.96, the calculated z-statistic falls into the rejection region.

Step 5: State the conclusion. Since the test statistic (z=14.142z = 14.142) is greater than the critical value (1.961.96), we reject the null hypothesis. There is sufficient evidence at the 0.05 level of significance to conclude that the mean breaking strength of the new synthetic fishing line is significantly different from 9 kg.

That's 2 down. 3 left today — send the next one.

Was this helpful?

Need help with your own homework?

Get instant step-by-step solutions to any question. Free to start.

Ask Your Question
Handwritten step-by-step solution preview

Handwritten Step-by-Step Solution

Get this as a handwritten image on WhatsApp — like a tutor wrote it for you.

Try on WhatsApp

Still have questions?

Quick Answer

ANOVA Table We need to find the missing values , , , , in the ANOVA table. Step 1: Calculate (Sum of squares for Within group).

Use the above table to find the missing values , beta, alpha, lambda and theta
Mathematics

This mathematics problem involves applying core mathematical principles and formulas. Below you will find a complete step-by-step solution with detailed explanations for each step, helping you understand not just the answer but the method behind it.

ScanSolve AI Answer
Here are the solutions for the problems. Problem 5: ANOVA Table We need to find the missing values , , , , in the ANOVA table. Step 1: Calculate (Sum of squares for Within group). The total sum of squares is the sum of the sum of squares for "Source of starch" and "Within group". SS_Total = SS_Between + SS_Within 58229.750 = 12112.250 + = 58229.750 - 12112.250 = 46117.500 Step 2: Calculate (df for Within group). Mean Square (MS) is calculated as Sum of Squares (SS) divided by df. MS_Within = SS_Withindf_Within 3843.125 = ()/() 3843.125 = (46117.500)/() = (46117.500)/(3843.125) = 12 Step 3: Calculate (df for Total). The total degrees of freedom is the sum of the degrees of freedom for "Source of starch" and "Within group". df_Total = df_Between + df_Within = 3 + = 3 + 12 = 15 Step 4: Calculate (Mean square for Source of starch). MS_Between = SS_Betweendf_Between = (12112.250)/(3) = 4037.417 (rounded to three decimal places) Step 5: Calculate (F-statistic). The F-statistic is the ratio of the Mean Square for "Source of starch" to the Mean Square for "Within group". F = MS_BetweenMS_Within = ()/(3843.125) = (4037.417)/(3843.125) = 1.051 (rounded to three decimal places) Problem 6: Hypothesis Test for Mean Breaking Strength We are testing the hypothesis that the mean breaking strength of the fishing line is 9 kg. Step 1: State the null and alternative hypotheses. The null hypothesis (H_0) is that the mean breaking strength is 9 kg. The alternative hypothesis (H_1) is that the mean breaking strength is not 9 kg. H_0: = 9 kg H_1: ≠ 9 kg Step 2: Determine the level of significance and critical values. The level of significance is = 0.05. Since this is a two-tailed test, we divide by 2: /2 = 0.05/2 = 0.025. The critical z-values for a 95% confidence level (or =0.05) in a two-tailed test are ± 1.96. Step 3: Calculate the test statistic. We use the z-test statistic because the population standard deviation () is known and the sample size (n) is large. The formula is: z = x - _0 / sqrt(n) Given: Sample mean (x) = 10 kg Hypothesized population mean (_0) = 9 kg Population standard deviation () = 0.5 kg Sample size (n) = 50 z = (10 - 9)/(0.5 / sqrt(50)) z = (1)/(0.5 / 7.0710678) z = (1)/(0.070710678) z ≈ 14.142 Step 4: Make a decision. Compare the calculated z-statistic to the critical values. The calculated z-statistic is 14.142. The critical z-values are ± 1.96. Since 14.142 > 1.96, the calculated z-statistic falls into the rejection region. Step 5: State the conclusion. Since the test statistic (z = 14.142) is greater than the critical value (1.96), we reject the null hypothesis. There is sufficient evidence at the 0.05 level of significance to conclude that the mean breaking strength of the new synthetic fishing line is significantly different from 9 kg. That's 2 down. 3 left today — send the next one.