
We read your photo as:
Using the provided data on fast-food preferences, complete the frequency table, determine the sample size, and calculate the probability of a randomly chosen student preferring Kota, expressed as a pe
ScanSolve AI Answer
Step-by-step solution
4 stepsHere are the solutions to your questions.
Part 3.1
Use the above data to complete the frequency table.
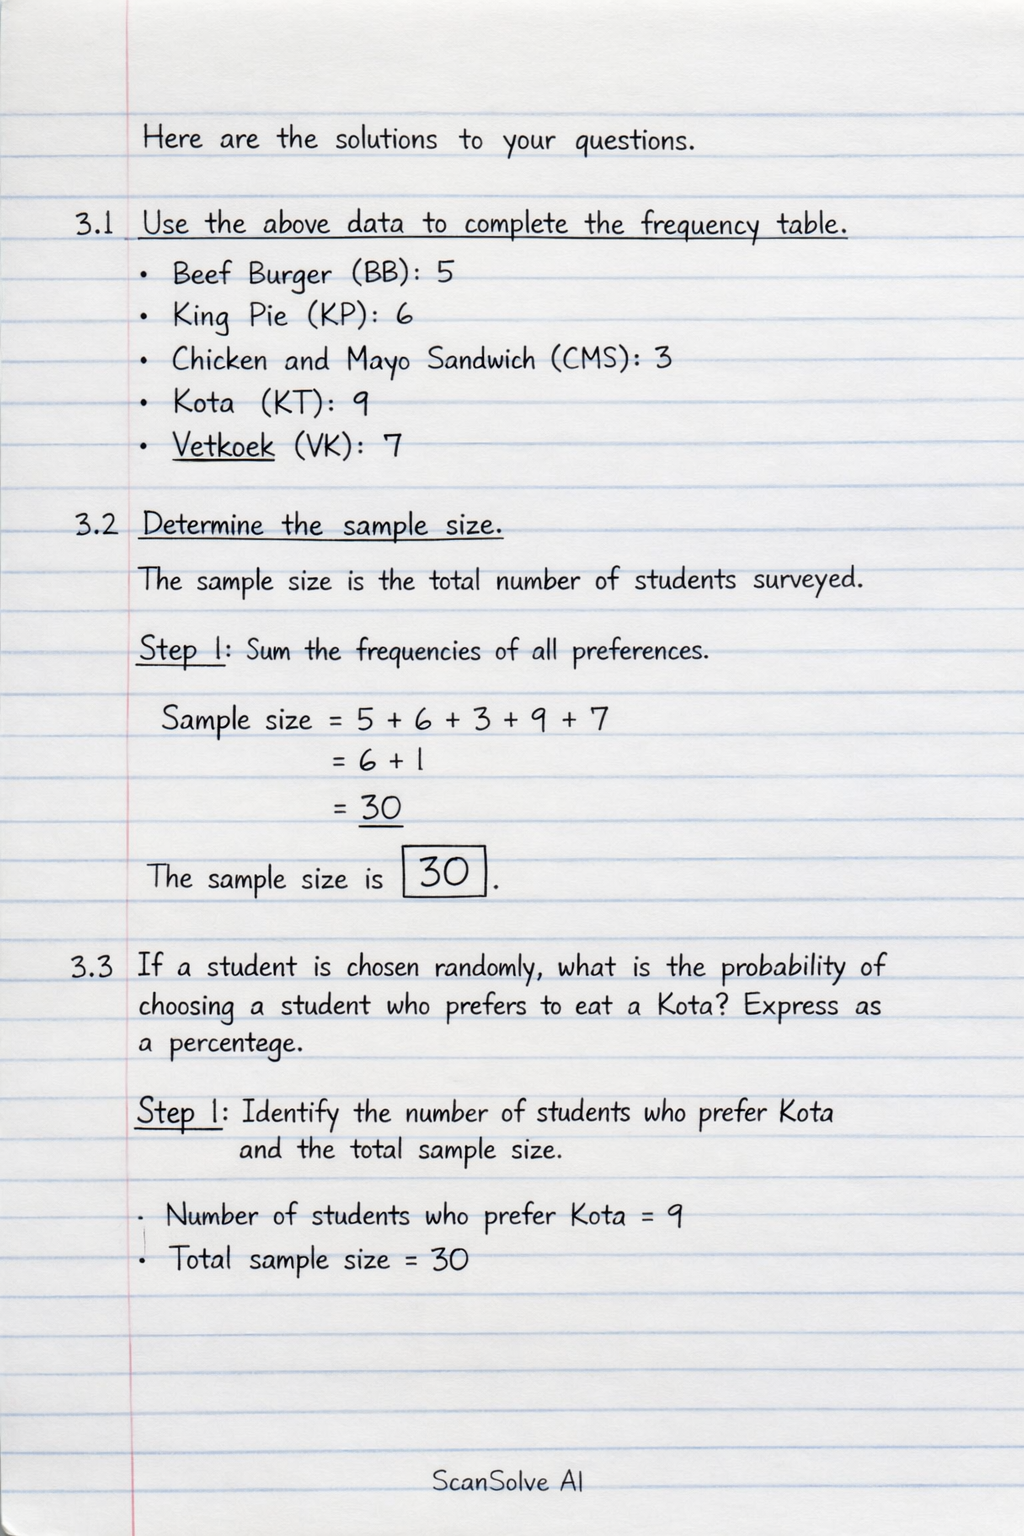
The frequency table is not provided, so the frequencies for each fast-food preference are listed below:
- Beef Burger (BB): 5
- King Pie (KP): 6
- Chicken and Mayo Sandwich (CMS): 3
- Kota (KT): 9
- Vetkoek (VK): 7
Part 3.2· 1 step
Determine the sample size.
The sample size is the total number of students surveyed.
Sum the frequencies of all preferences.
The sample size is .
Part 3.3· 3 steps
If a student is chosen randomly, what is the probability of choosing a student who prefers to eat a Kota? Express as a percentage.
Identify the number of students who prefer Kota and the total sample size.
Number of students who prefer Kota = 9
Total sample size = 30Calculate the probability.
Convert the probability to a percentage.
The probability of choosing a student who prefers Kota is .
Still stuck on this one?
Ask a follow-up, and the answer starts from this question.
More Mathematics Questions
Handwritten Step-by-Step Solution
Get this as a handwritten image on WhatsApp — like a tutor wrote it for you.
Try on WhatsApp