
We read your photo as:
A speed-time graph shows an athlete accelerating from rest for 2 seconds to a speed of 8 m/s, then maintaining that speed for 8 seconds. Calculate the total distance covered in the first 10 seconds.
Physics
ScanSolve AI Answer
Answer
Step-by-step solution
3 stepshere's the solution for the speed-time graph problem:
a) Calculate the distance the athlete runs in the first 10 seconds.
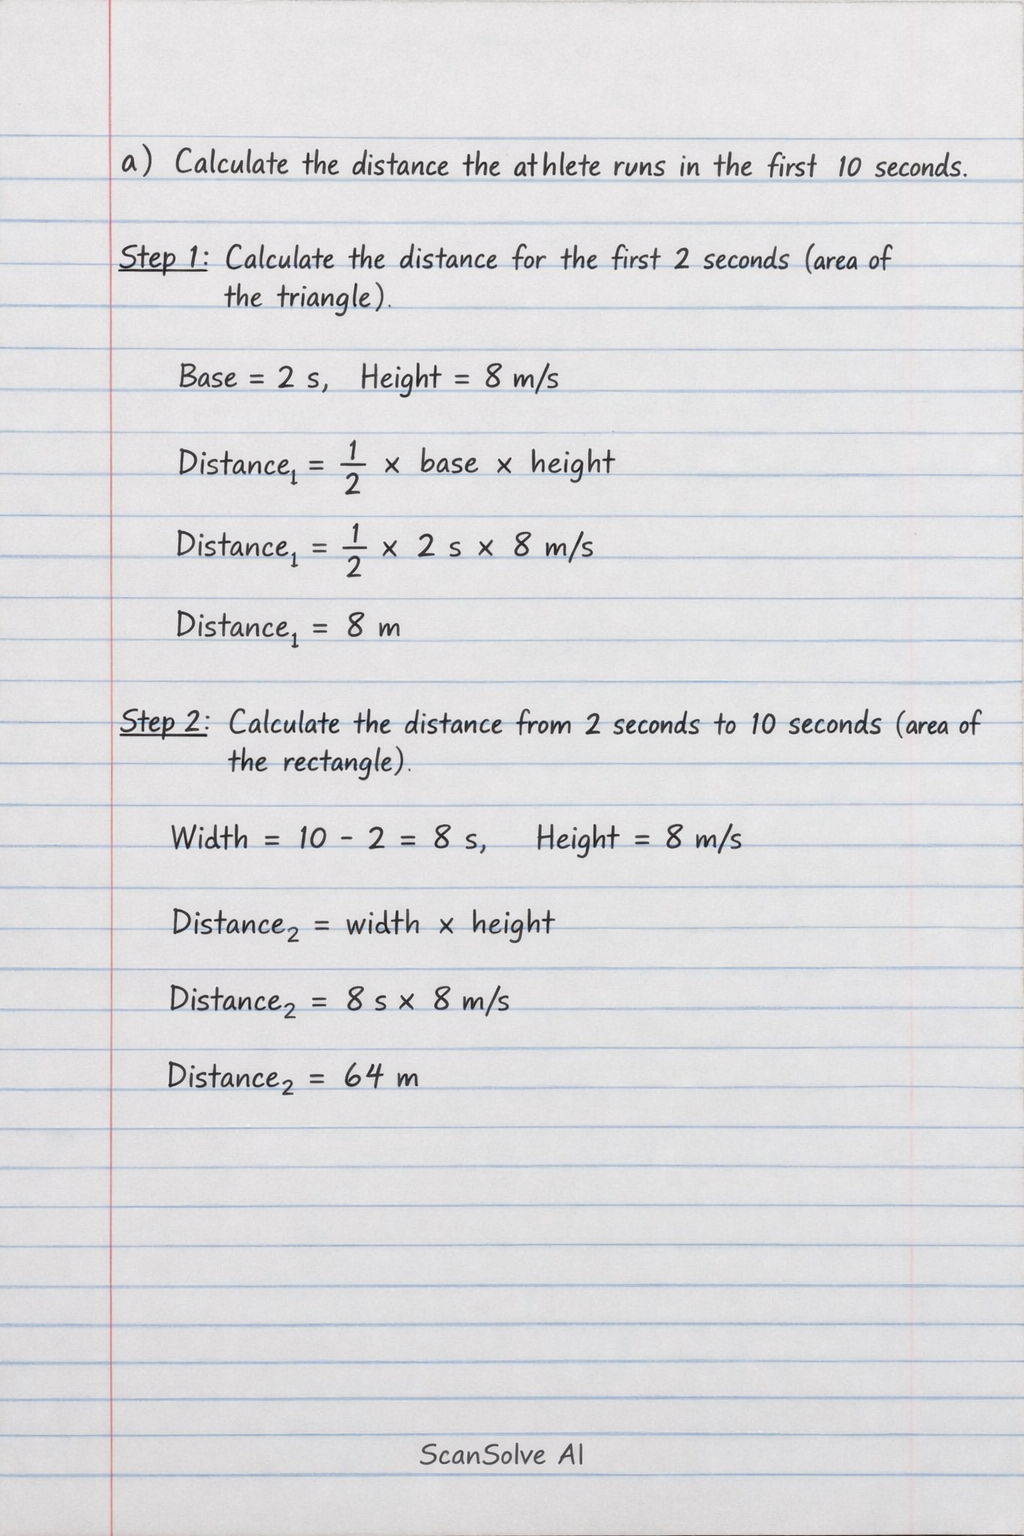
The distance run is represented by the area under the speed-time graph. The graph can be divided into two parts: a triangle for the first 2 seconds and a rectangle for the next 8 seconds.
Calculate the distance for the first 2 seconds (area of the triangle).
The base of the triangle is 2 seconds and the height is 8 m/s.
Calculate the distance from 2 seconds to 10 seconds (area of the rectangle).
The width of the rectangle is seconds and the height is 8 m/s.
Calculate the total distance.
The distance the athlete runs in the first 10 seconds is .
Was this helpful?
Try one yourself
A new problem that tests the same skill.
Still stuck on this one?
Ask a follow-up, and the answer starts from this question.
Got a different question?Ask your own question
More Physics Questions
QFigure 5 is a speed-time graph of an object. Given that the total distance travelled by the object…QA velocity-time graph for a car shows acceleration for the first 2s, constant velocity for the next…QThe length of the race is 100m. After 10 seconds, the athlete continues to run at a speed of 8m/s…QA car accelerates from rest to 20 m/s in 10s, stays at 20 m/s for 20s, then decelerates to rest in…QFig. 1.2 shows a sketch of a speed-time graph for the motion of another horse that also ran for 30…
Handwritten Step-by-Step Solution
Get this as a handwritten image on WhatsApp — like a tutor wrote it for you.
Try on WhatsApp