
We read your photo as:
A table of experimental data for H and N is provided. i. Identify and correct the error. ii. Plot a graph of H against N.
ScanSolve AI Answer
Here are the solutions to the problems:
1. Data Analysis
-
i. Identify and correct the error associated with the above table. The primary error associated with the table, in a practical physics context, is the absence of stated uncertainties for the measured values of H and N. Without these uncertainties, it is impossible to quantify the reliability of the measurements or to calculate standard errors for derived quantities like slope and intercept. Correction: Each reading should ideally be presented with an associated uncertainty, e.g., and .
-
ii. Plot a graph of H against N. A graph of H (y-axis) against N (x-axis) should
Still stuck on this one?
Ask a follow-up, and the answer starts from this question.
More Physics Questions
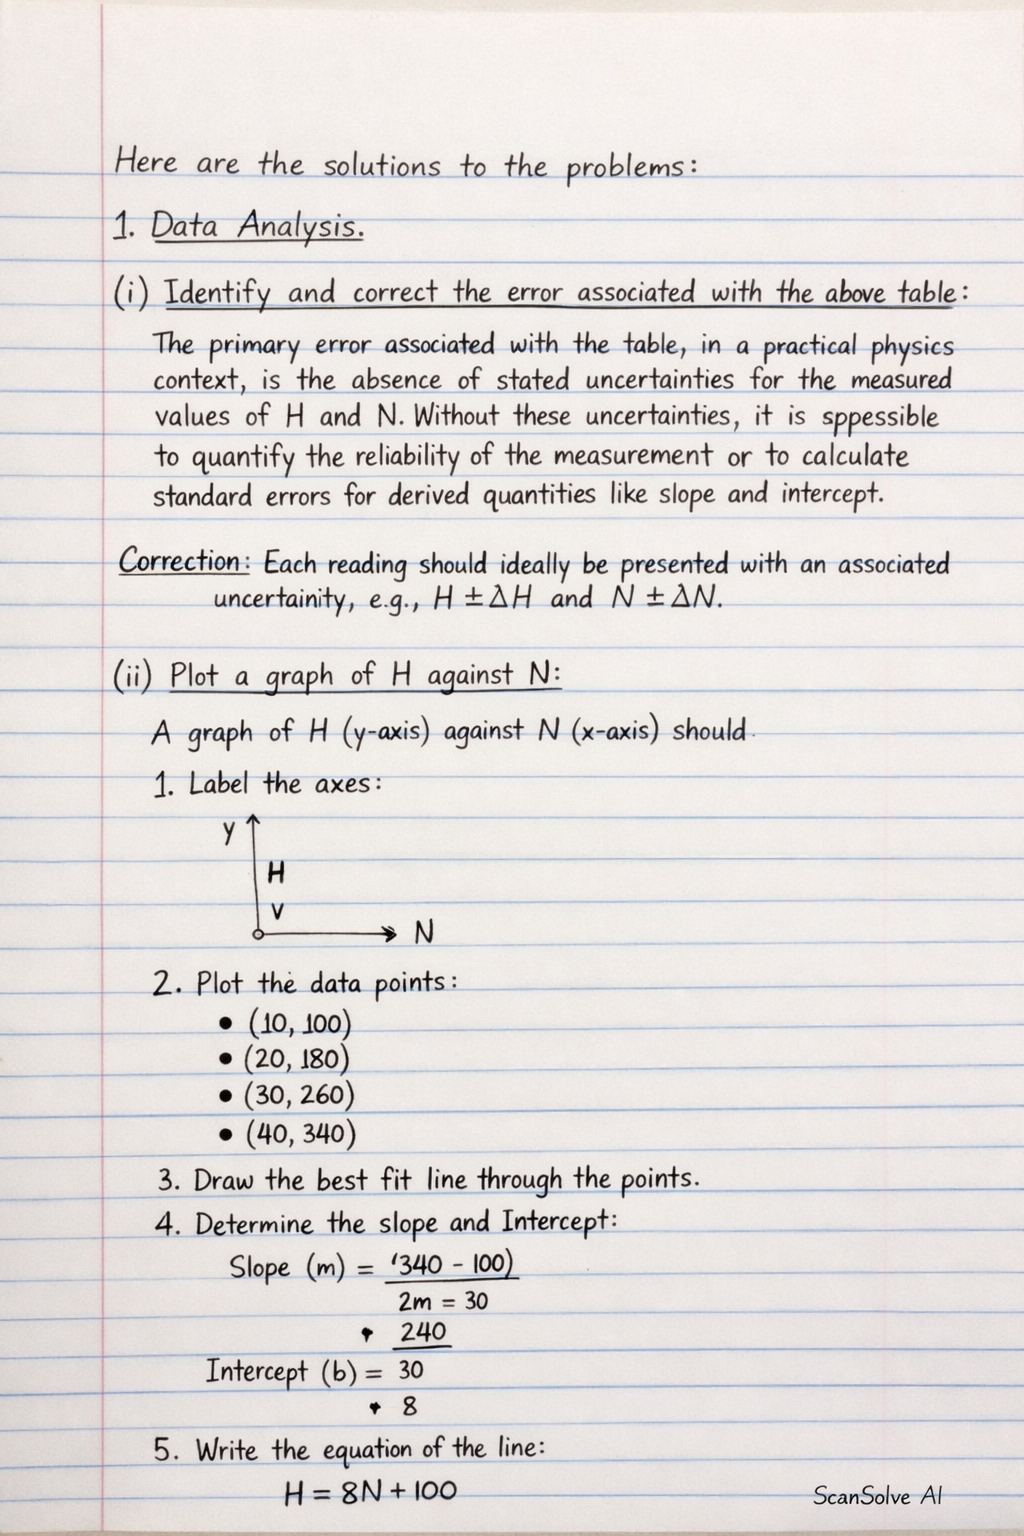
Handwritten Step-by-Step Solution
Get this as a handwritten image on WhatsApp — like a tutor wrote it for you.
Try on WhatsApp