
We read your photo as:
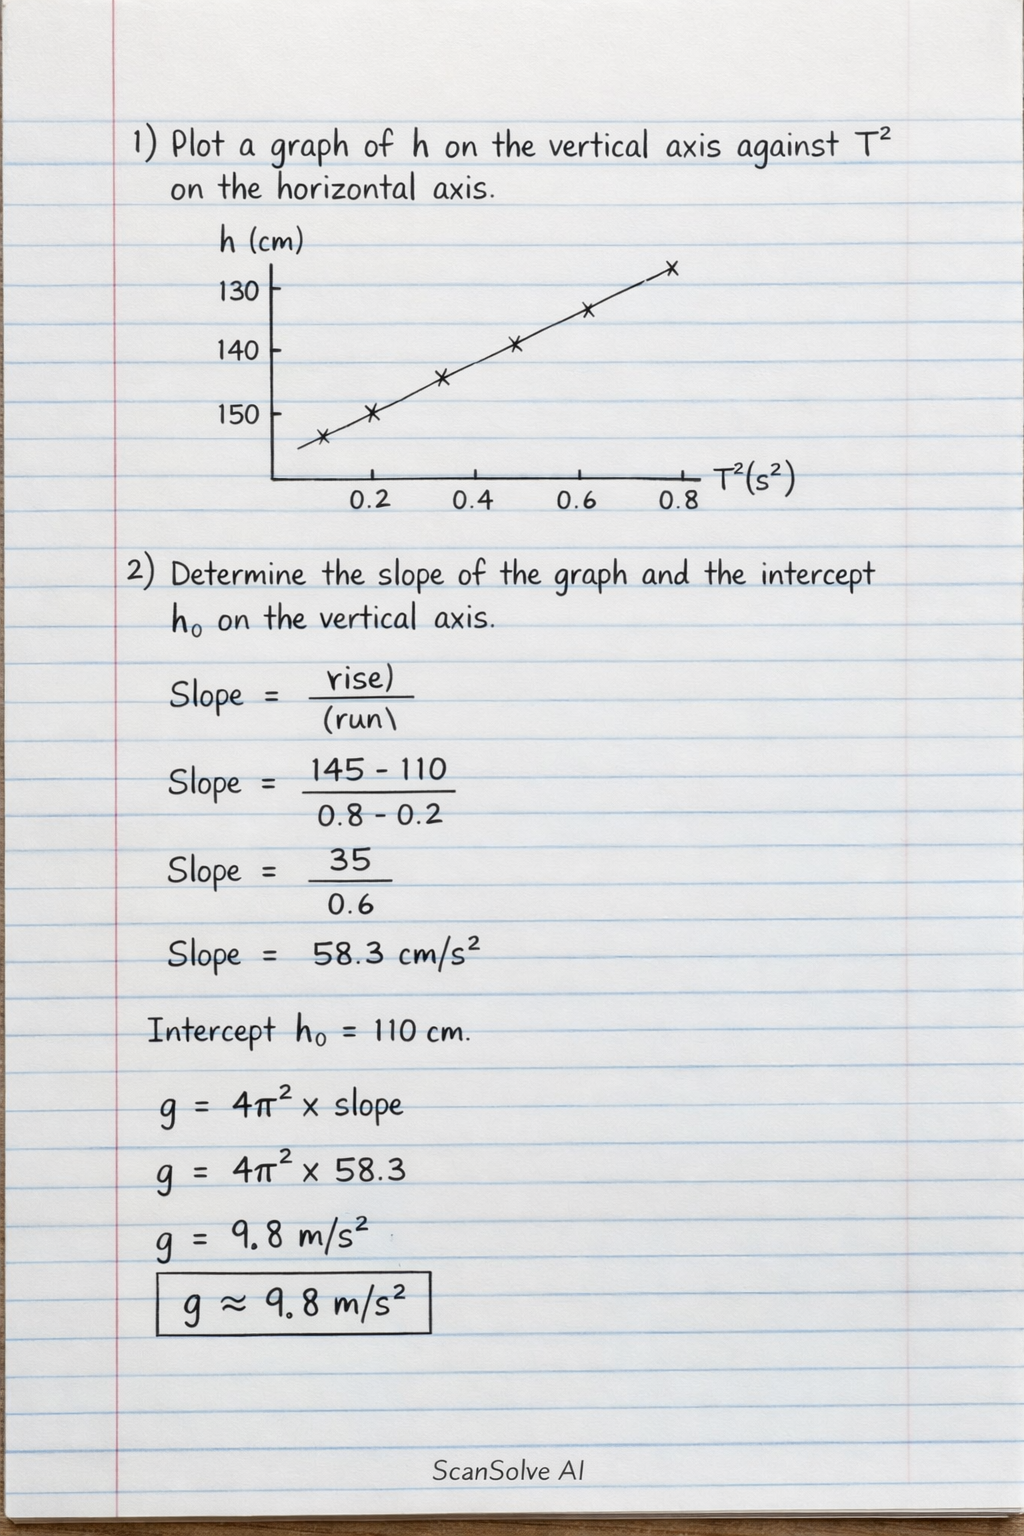
Plot a graph of h on the vertical axis against T 2 on the horizontal axis. Determine the slopes of the graph and the intercept h0 on the vertical axis.
ScanSolve AI Answer
Here are the answers based on the provided image:
State the aim of this experiment:
The aim of this experiment is to determine the acceleration due to gravity and the height of the ceiling of the laboratory using a simple pendulum.
Table I:
The column for "t (s) for 25 oscillations" is empty. Without this experimental data, it is not possible to complete the table by calculating and .
Exercise:
(i) Plot a graph of h on the vertical axis against T² on the horizontal axis.
(ii) Determine the slopes of the graph and the intercept h0 on the vertical axis.
To complete these exercises, the experimental data for "t (s) for 25 oscillations" is required. Once that data is available, you would:
- Calculate for each value.
- Calculate for each value.
- Plot (y-axis) against
T²(x-axis). - Draw a best-fit line through the plotted points.
- Calculate the slope () of this line using two points on the line: .
- Identify the y-intercept (), which is the value of where the line crosses the y-axis (i.e., when ).
Still stuck on this one?
Ask a follow-up, and the answer starts from this question.
More Physics Questions
Handwritten Step-by-Step Solution
Get this as a handwritten image on WhatsApp — like a tutor wrote it for you.
Try on WhatsApp