
We read your photo as:
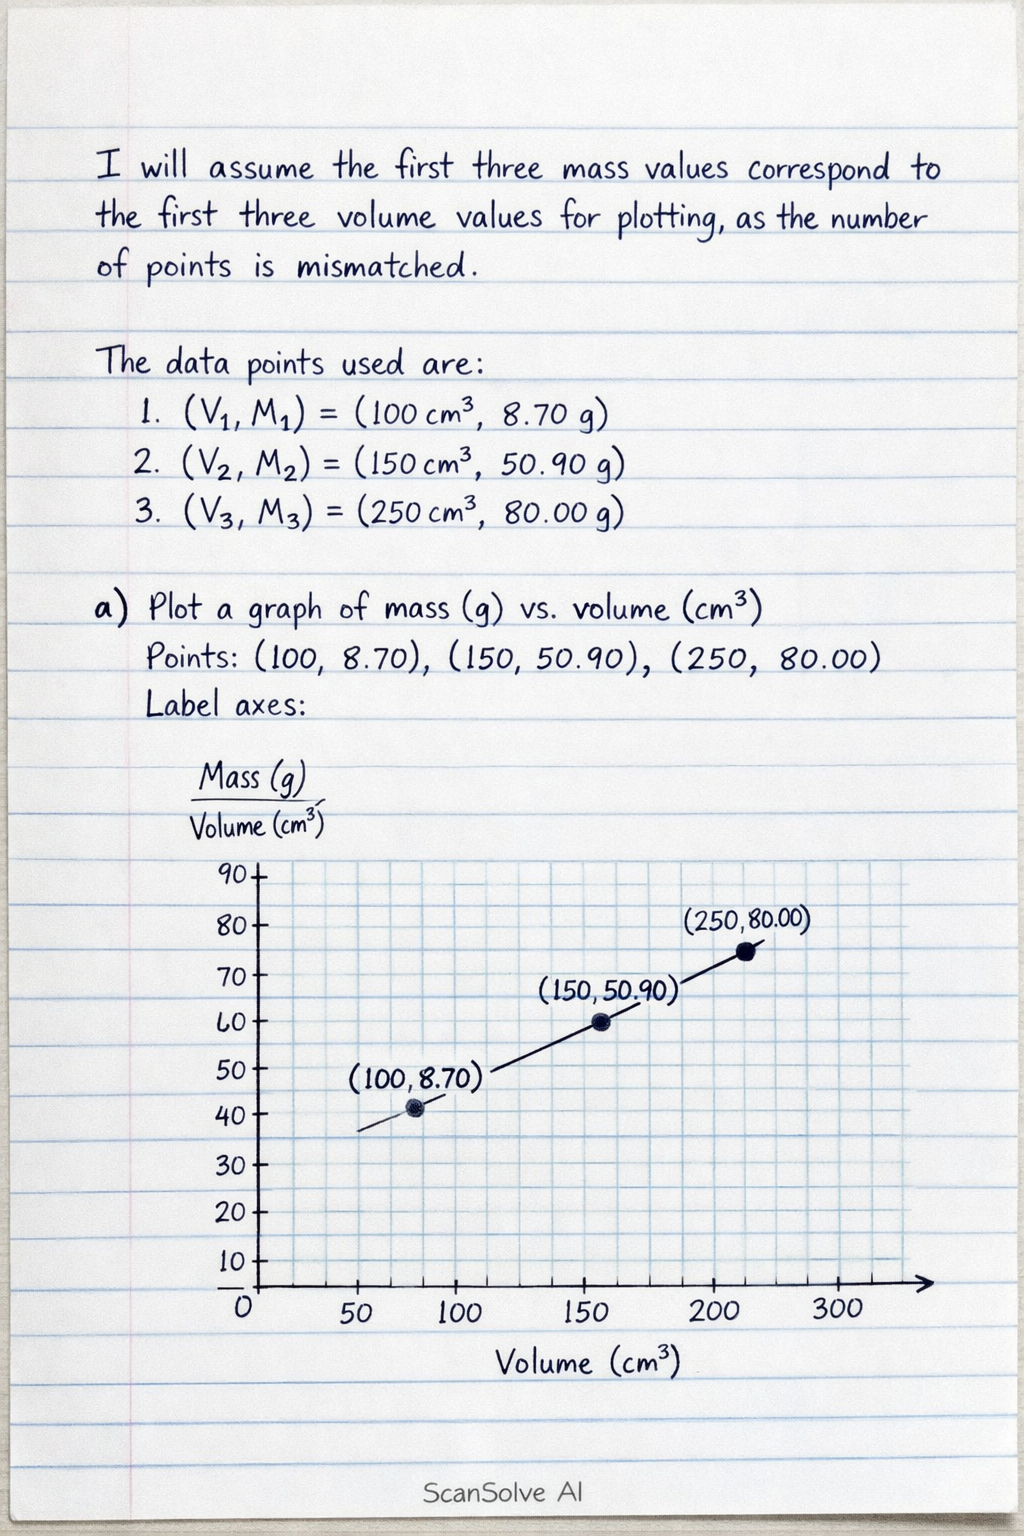
A table of volume (cm3) and mass (g) values is provided. Plot a graph of mass vs. volume using the first three data points.
Physics
ScanSolve AI Answer
I will assume that the first three mass values correspond to the first three volume values for plotting and calculations, as there is a mismatch in the number of data points provided in the table. The data points used are:
a) Plot a graph of mass (g) on the vertical
Was this helpful?
Still stuck on this one?
Ask a follow-up, and the answer starts from this question.
Got a different question?Ask your own question
More Physics Questions
QThe provided table contains a mismatch in the number of mass and volume data points. I will assume…QI need help plotting a graph for an experiment involving mass and the stretching of a band. Here's…QPlot a graph of water mass versus water volume and draw the best fit line. Calculate the slope. What…QPlot a graph of y against M from the given data, and determine its slope. M is mass in grams, y is…Qc) Draw a sketch of a graph illustrating the relationship between the volume of a fixed mass of a…
Handwritten Step-by-Step Solution
Get this as a handwritten image on WhatsApp — like a tutor wrote it for you.
Try on WhatsApp