
We read your photo as:
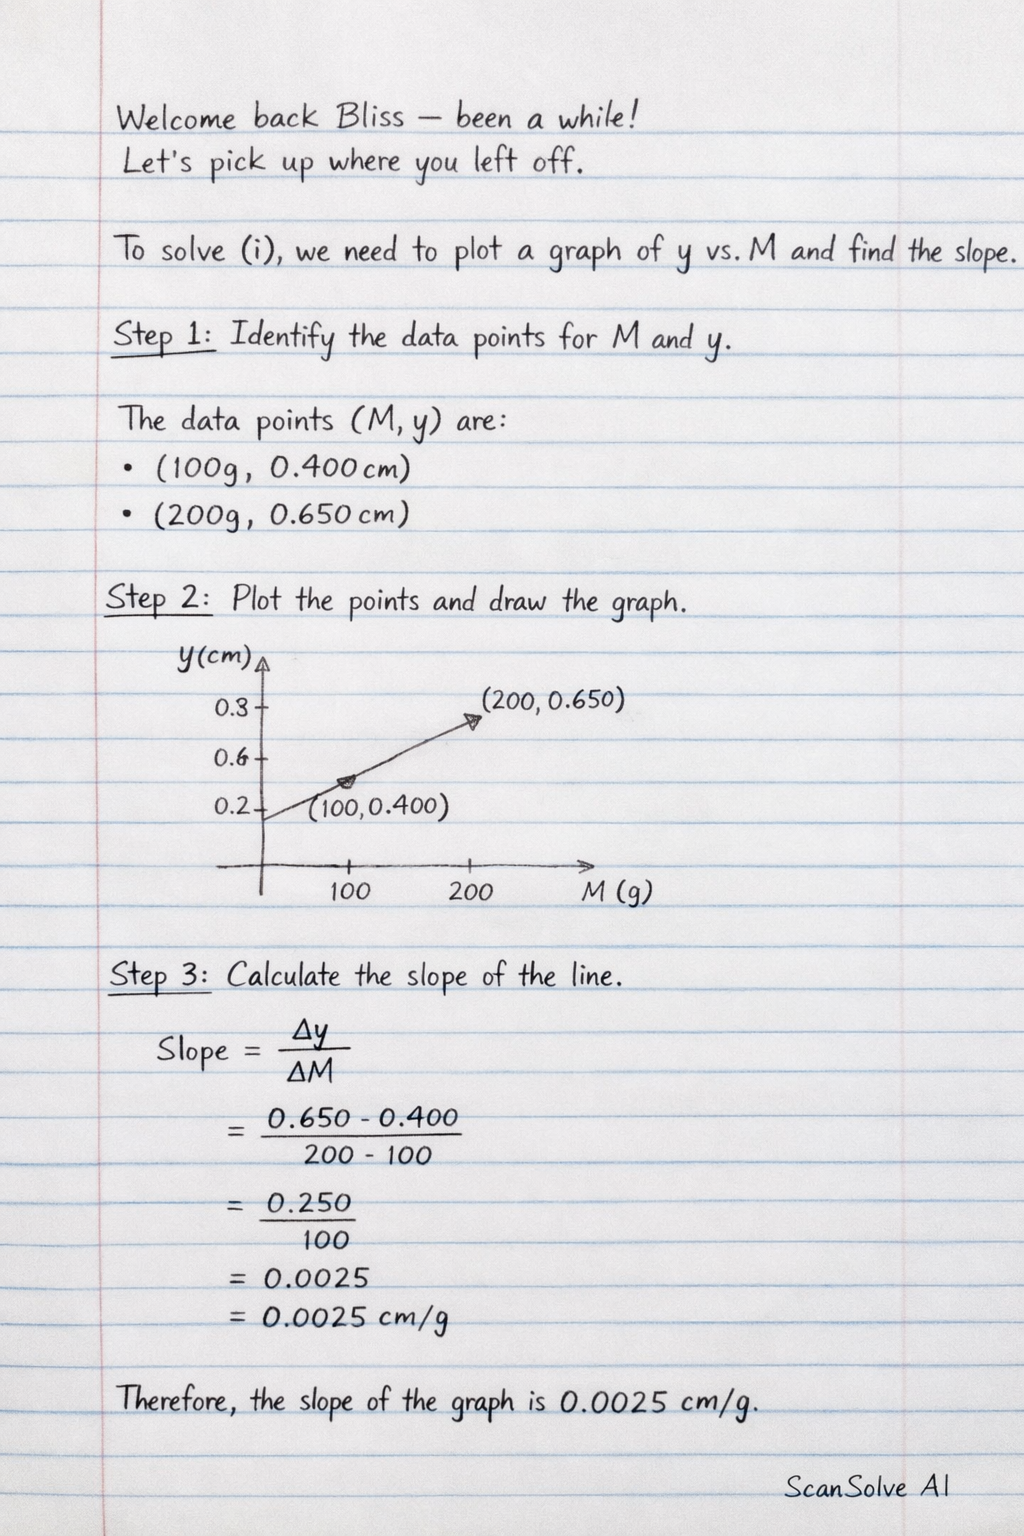
Plot a graph of y against M from the given data, and determine its slope. M is mass in grams, y is depression in cm (y0 - ym). Data points: (100g, 0.400cm), (200g, 0.650cm).
Physics
ScanSolve AI Answer
This answer stops before the end.
It was cut off when it was first written. Ask ScanSolve this question again for the full working.
To solve question (i), we need to plot a graph of against and then determine its slope. Based on the table and the procedure, is the mass in grams, and refers to the depression, which is given by the row "" in centimeters.
Step 1: Identify the data points for and .
The data points are:
Was this helpful?
Still stuck on this one?
Ask a follow-up, and the answer starts from this question.
Got a different question?Ask your own question
More Physics Questions
QM = change in y / change in x. Calculate M for the given points in the example.QPlot a graph of M on the vertical axis and T 2 on the horizontal axis, starting both axes from the…QTo determine the slope of a graph where 'm' is plotted as the abscissa (x-axis) and 'V' is plotted…QWhat are the data points for M and y based on the provided table?QHow to i plot a graph and calculate slope?
Handwritten Step-by-Step Solution
Get this as a handwritten image on WhatsApp — like a tutor wrote it for you.
Try on WhatsApp