
We read your photo as:
Compare the diffusion rates of gases and liquids, and explain how to create a bar graph based on experimental data.
ScanSolve AI Answer
Step-by-step solution
2 stepsAnswer 1.1.7
From the comparison of particle movement and diffusion speed between gas (deodorant) and liquid (juice in water) in question 1.1.6, the conclusion is that gases diffuse significantly faster than liquids. This is because gas particles are much further apart and possess higher kinetic energy, allowing them to move more freely and rapidly to fill the available space compared to liquid particles, which are closer together and have less kinetic energy.
Answer 1.1.8
To draw a bar graph, you would need the specific results recorded in your table. Since the table is not provided, I cannot draw the graph for you. However, here are the general requirements for drawing it:
- Caption: The graph needs a clear, descriptive title (e.g., "Effect of Temperature on Rate of Diffusion").
- Independent and Dependent Variables: The independent variable (the factor you changed, e.g., different temperatures of water) should be plotted on the x-axis. The dependent variable (the factor you measured, e.g., time taken for diffusion or rate of diffusion) should be plotted on the y-axis. Both axes must be clearly labeled with units (e.g., Temperature (), Time (s)).
- Neatness: Use a ruler to draw the axes and bars. Ensure the bars are of equal width and spaced evenly. Choose an appropriate scale for the y-axis to make the data clear and easy to read.
Still stuck on this one?
Ask a follow-up, and the answer starts from this question.
More Physics Questions
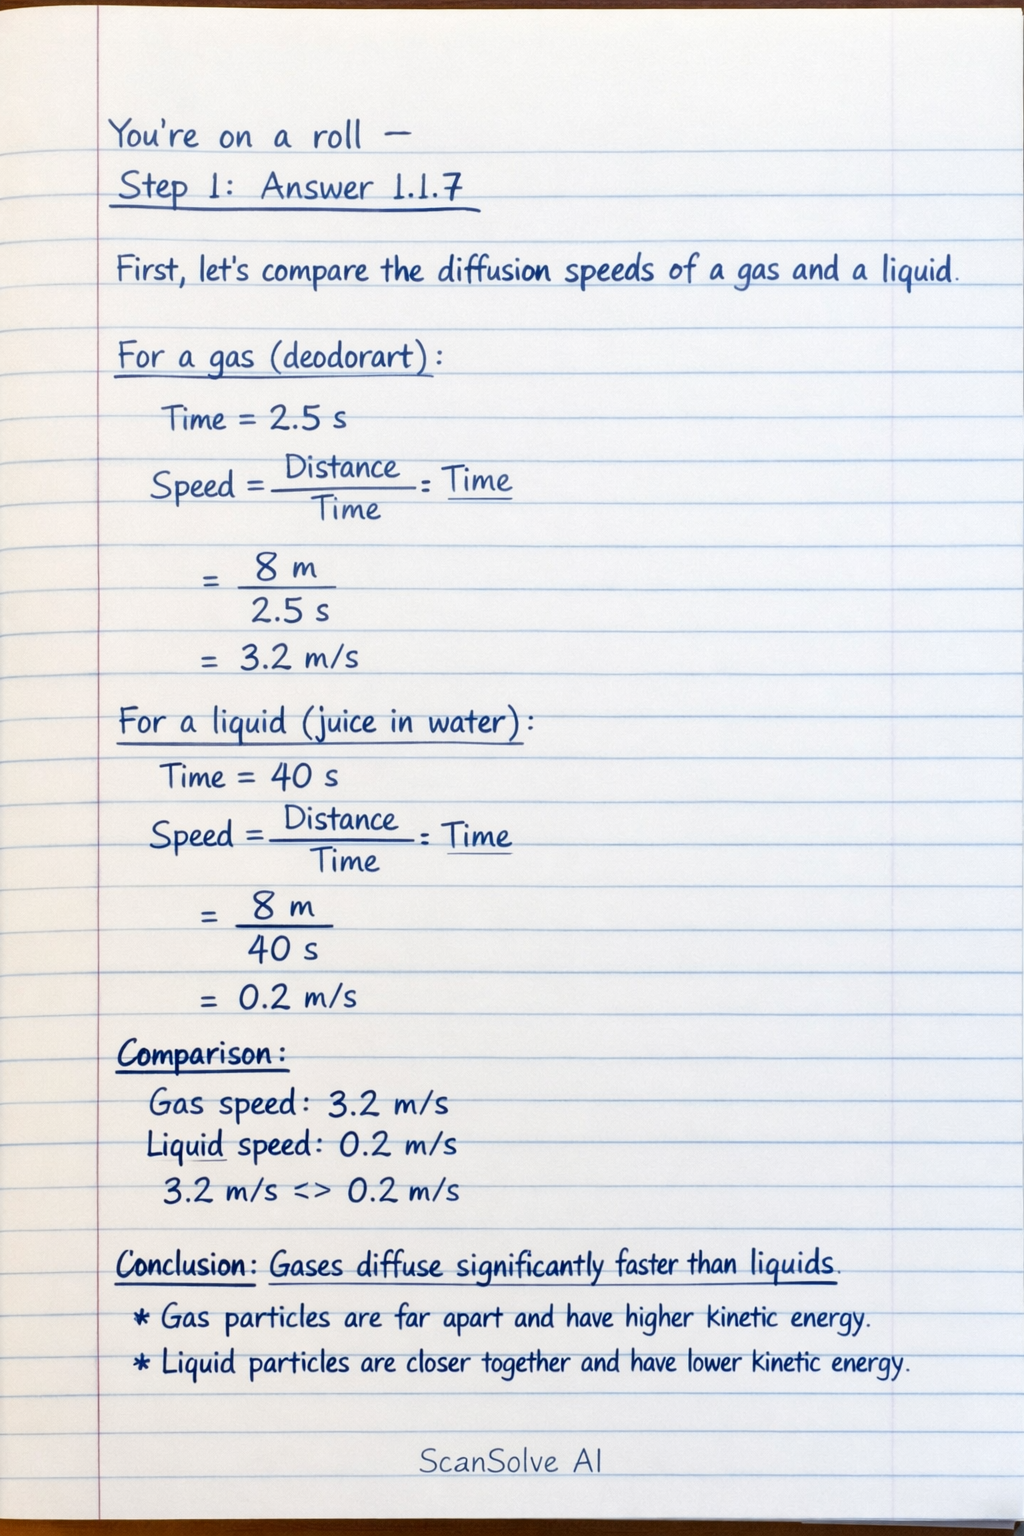
Handwritten Step-by-Step Solution
Get this as a handwritten image on WhatsApp — like a tutor wrote it for you.
Try on WhatsApp