
We read your photo as:
For the given circuit, assuming a series resistor of 220 ohms and a silicon diode, create a table of readings and plot a graph of If vs Vf.
Physics
ScanSolve AI Answer
Here are the answers to your questions based on the provided circuit diagram.
Assumptions:
- The series resistor .
- The diode is a silicon diode, with a typical forward voltage drop () starting around and increasing slightly with current.
- The values for and are estimated based on these assumptions, as no specific diode characteristics or experimental data were provided.
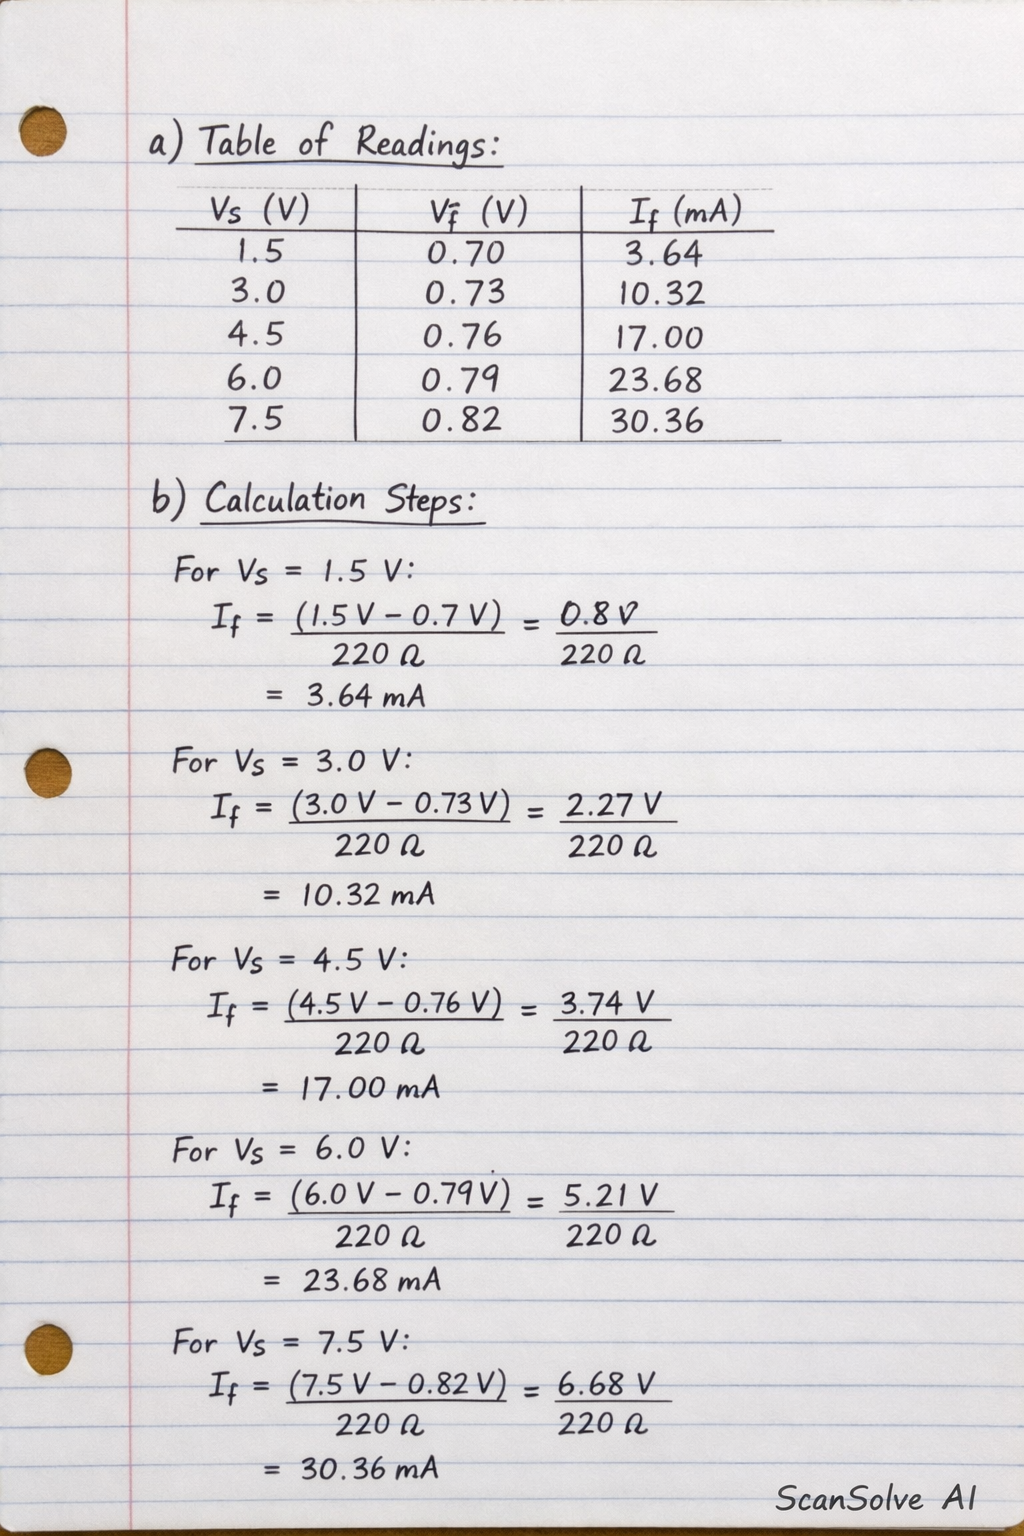
a) Tabulate your readings
| (V) | (V) | (mA) |
|---|---|---|
| 1.5 | 0.70 | 3.64 |
| 3.0 | 0.73 | 10.32 |
| 4.5 | 0.76 | 17.00 |
| 6.0 | 0.79 | 23.68 |
| 7.5 | 0.82 | 30.36 |
b) Plot a graph of and
To plot the graph, you would use the data from the table above.
- Plot on the x-axis (horizontal axis) and on the y-axis (vertical axis).
- The points to plot are: , , $(0
Was this helpful?
Still stuck on this one?
Ask a follow-up, and the answer starts from this question.
Got a different question?Ask your own question
More Physics Questions
QProblem 14: Given a JFET circuit with specified parameters and a diagram (Fig. 7.86), determine ID…QA) Plot the graph between If and Vf. b) State the precautions taken during the experiment for you to…QA circuit consists of a 5V source, a 100 ohm resistor R, and two diodes D1 and D2 in series…QUsing Ohm's Law (V=IR), calculate the current, resistance, and voltage for the following circuits:QUsing the provided graph, estimate V when I = 10.0 A, estimate I when V = 8.0 V, and determine the…
Browse by topic:Electrical Engineering
Handwritten Step-by-Step Solution
Get this as a handwritten image on WhatsApp — like a tutor wrote it for you.
Try on WhatsApp