

This physics problem tests your understanding of fundamental physical laws and their applications. The step-by-step solution below breaks down the problem using relevant equations and physical reasoning.
ScanSolve AI Answer
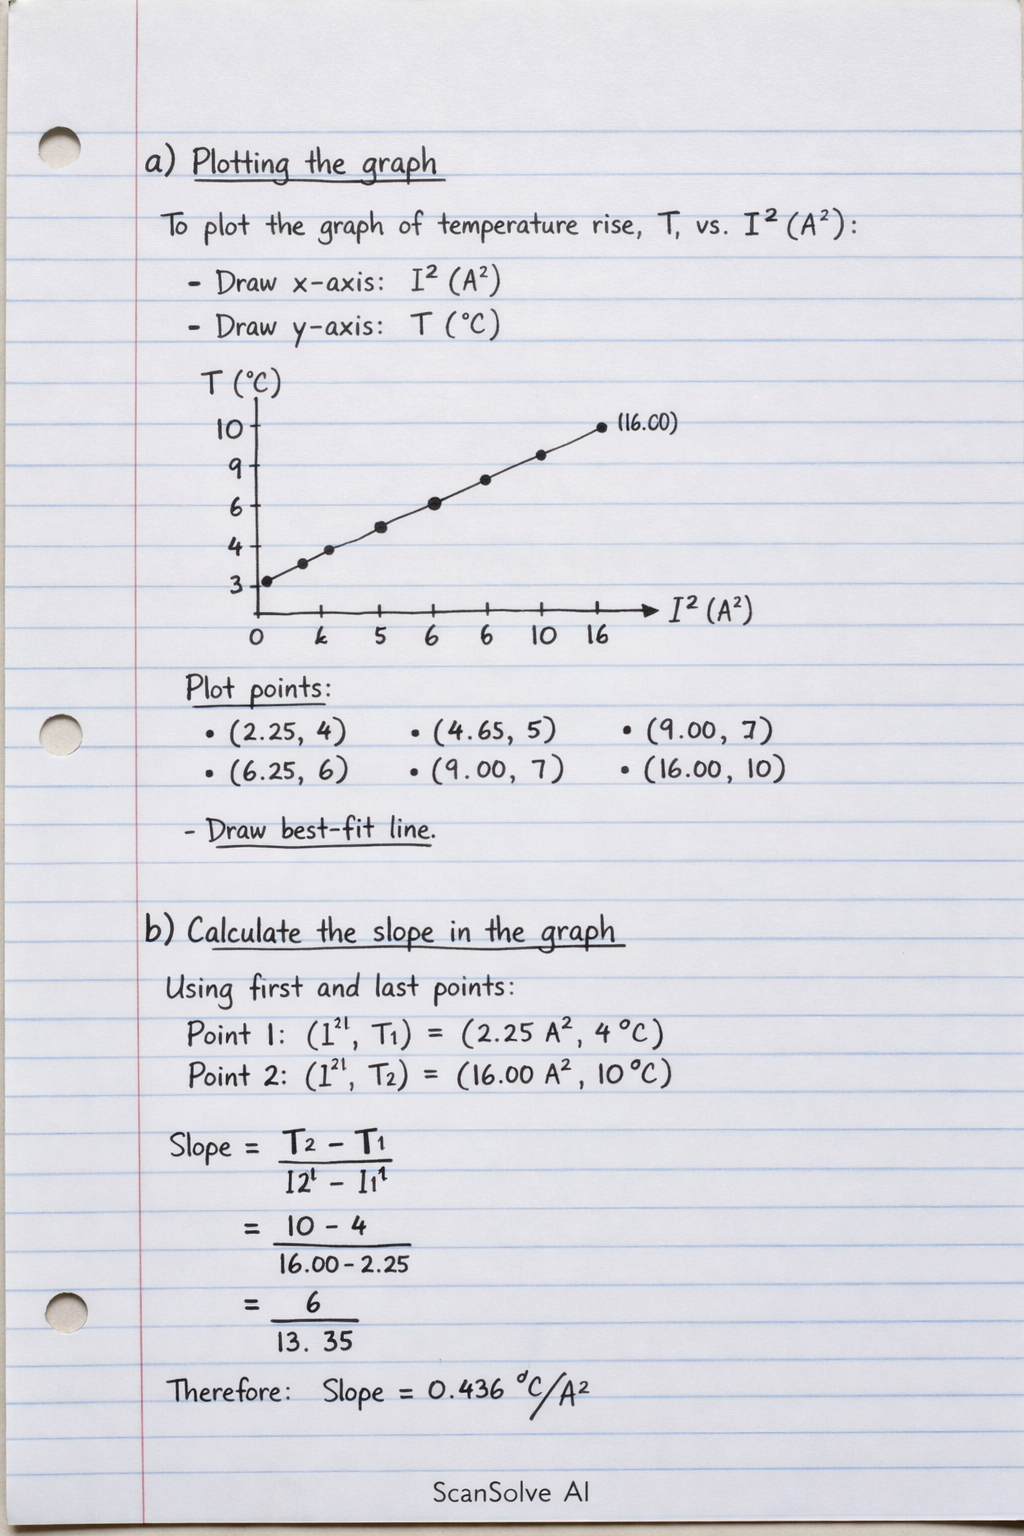
a) Plotting the graph To plot the graph of temperature rise, T, against the square of the current, I^2: • Draw a horizontal axis (x-axis) and label it "I^2 (A²)" for the square of the current. • Draw a vertical axis (y-axis) and label it "T (°C)" for the temperature rise. • Choose appropriate scales for both axes to accommodate the range of values: • For I^2: from 0 to 16 A². • For T: from 0 to 10 °C. • Plot the following data points from the table: • (2.25, 4) • (4.00, 5) • (6.25, 6) • (9.00, 7) • (12.25, 8) • (16.00, 10) • Draw the best-fit straight line through these plotted points. b) Calculate the slope in the graph We will use the first and last data points to calculate the slope of the best-fit line. Point 1: (I_1^2, T_1) = (2.25 \, A^2, 4 \, ^C) Point 2: (I_2^2, T_2) = (16.00 \, A^2, 10 \, ^C) Step 1: Write the formula for the slope. Slope = ( T)/( I^2) = (T_2 - T_1)/(I_2^2 - I_1^2) Step 2: Substitute the values into the formula. Slope = 10 \, ^ - 4 \, ^C16.00 \, A^2 - 2.25 \, A^2 Step 3: Calculate the slope. Slope = 6 \, ^13.75 \, A^2 Slope ≈ 0.436 \, ^A^2 The slope of the graph is 0.436 \, ^A^2. c) Possible errors from this experiment • Heat loss to the surroundings: The heating element may not be perfectly insulated, leading to some heat escaping. • Inaccurate instrument readings: Errors can occur due to uncalibrated ammeters or thermometers, or parallax errors when reading scales. • Fluctuations in current: The power supply might not provide a perfectly stable current throughout the experiment. • Non-uniform temperature distribution: The temperature sensor might not measure the average temperature accurately if the heat is not evenly distributed. d) Precautions • Insulate the heating element: Use insulating materials to minimize heat loss to the environment. • Ensure accurate readings: Read the ammeter and thermometer at eye level to avoid parallax errors. Use instruments with appropriate precision. • Use a stable power supply: Employ a regulated power supply to maintain a constant current. • Stir the liquid (if applicable): If heating a liquid, stir it continuously to ensure uniform temperature distribution. e) Conclusion The experiment demonstrates that the temperature rise in a conductor is directly proportional to the square of the current flowing through it, which is consistent with Joule's law of heating. The positive slope of the graph indicates this direct relationship. Send me the next one 📸