
We read your photo as:
Redraw the above graph in the ANSWER BOOK. On the same set of axes, use a BROKEN LINE to sketch the graph that will be obtained for the diatomic gas above. Fully explain why this diatomic gas deviates from ideal behaviour.
ScanSolve AI Answer
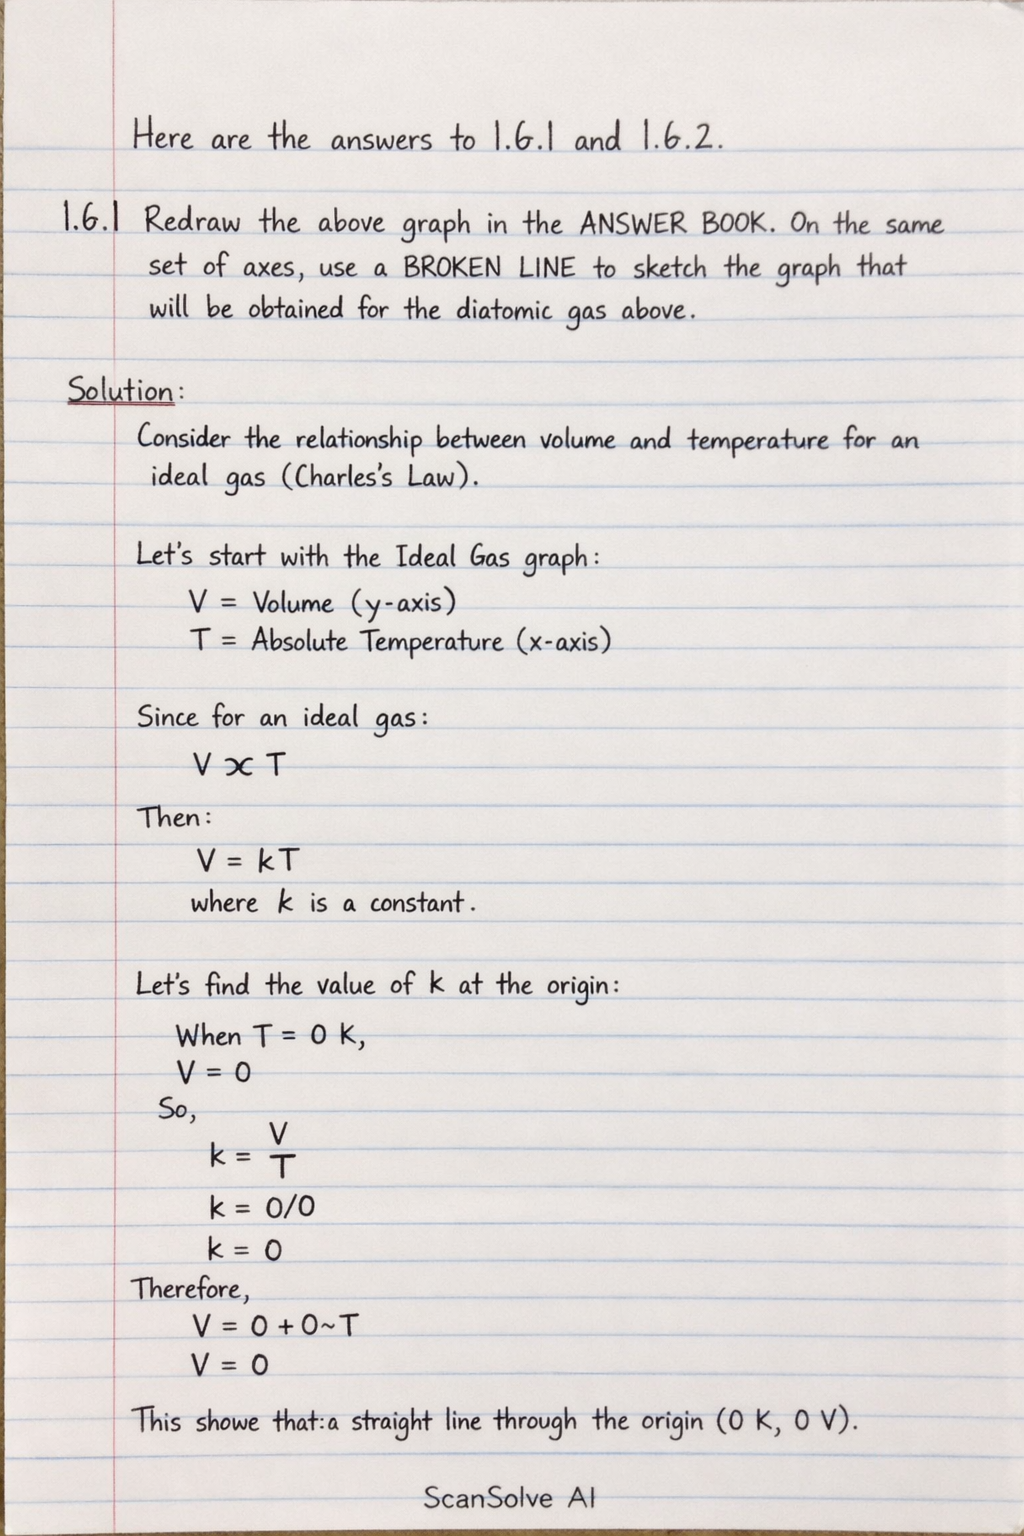
Here are the answers to 1.6.1 and 1.6.2.
1.6.1 Redraw the above graph in the ANSWER BOOK. On the same set of axes, use a BROKEN LINE to sketch the graph that will be obtained for the diatomic gas above.
The "above graph" refers to the relationship between volume and temperature for an ideal gas (Charles's Law). This graph typically plots Volume (V) on the y-axis against Absolute Temperature (T in Kelvin) on the x-axis.
- Ideal Gas Graph (Solid Line): For an ideal gas, the graph of Volume versus Absolute Temperature is a straight line passing through the origin (0 K, 0 V). This represents a direct proportionality: .
- Diatomic Gas Graph (Broken Line): For a real gas like N, the graph will deviate from ideal behavior. At high temperatures and low pressures, real gases behave almost ideally. However, as the temperature decreases, the real gas graph will typically fall below the ideal gas line. This is because intermolecular attractive forces become more significant at lower temperatures, causing the gas to occupy a smaller volume than predicted by the ideal gas law. The gas will eventually condense into a liquid at a certain low temperature, at which point the volume will drop sharply.
Description of the graph:
Imagine a graph with the x-axis labeled "Temperature (K)" and the y-axis labeled "Volume (V)".
- Draw a solid straight line starting from the origin (0 K, 0 V) and sloping upwards. This represents the ideal gas.
- Draw a broken line on the same axes. This line should start very close to the ideal gas line at higher temperatures. As the temperature decreases, the broken line should gradually curve below the solid ideal gas line, indicating a smaller volume for the real gas compared to the ideal gas at the same temperature.
1.6.2 Fully explain why this diatomic gas deviates from ideal behaviour.
Real gases, like the diatomic gas N, deviate from ideal behavior because they do not perfectly adhere to the assumptions of the Ideal Gas Law. The two main reasons for this deviation are:
- Volume of Gas Particles: The Ideal Gas Law assumes that gas particles have negligible volume. In reality, N molecules have a finite volume. At high pressures, the volume occupied by the N molecules themselves becomes a significant fraction of the total container volume. This means the actual free space available for the molecules to move is less than the measured volume, leading to a higher pressure than predicted by the ideal gas law.
- Intermolecular Forces: The Ideal Gas Law assumes there are no attractive or repulsive forces between gas particles. However, N molecules experience weak attractive intermolecular forces (London dispersion forces). At low temperatures and high pressures, these forces become more significant, pulling the molecules closer together. This reduces the frequency and force of collisions with the container walls, resulting in a lower pressure or a smaller volume than predicted by the ideal gas law.
Still stuck on this one?
Ask a follow-up, and the answer starts from this question.
More Physics Questions
Handwritten Step-by-Step Solution
Get this as a handwritten image on WhatsApp — like a tutor wrote it for you.
Try on WhatsApp