
Revision graphs of velocity, acceleration, displacement
Physics
ScanSolve AI Answer
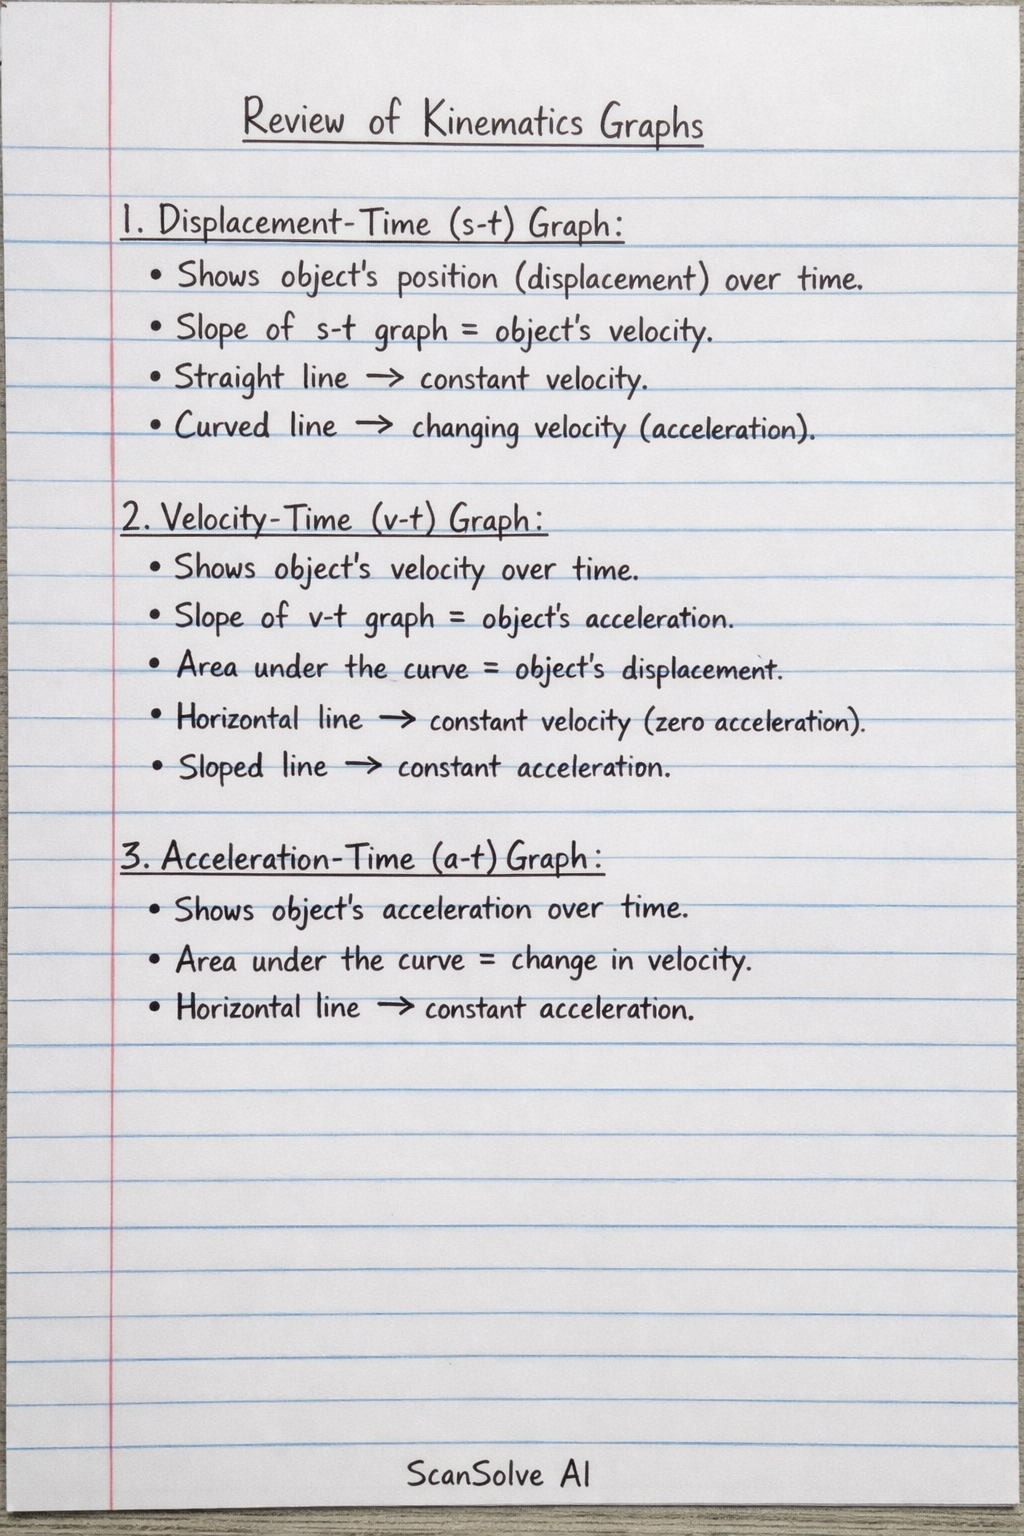
Here's a revision of graphs for displacement, velocity, and acceleration:
-
Displacement-Time Graph ( graph):
- This graph shows an object's position (displacement) over time.
- The slope of the graph represents the object's velocity.
- A straight line indicates constant velocity, while a curved line indicates changing velocity (acceleration).
-
Velocity-Time Graph ( graph):
- This graph shows an object's velocity over time.
- The slope of the graph represents the object's acceleration.
- The area under the curve of the graph represents the object's displacement.
- A horizontal line means constant velocity (zero acceleration), and a straight sloped line means constant acceleration.
-
Acceleration-Time Graph ( graph):
- This graph shows an object's acceleration over time.
- The area under the curve of the graph represents the change in velocity of the object.
- A horizontal line indicates constant acceleration.
In summary:
Was this helpful?
Still stuck on this one?
Ask a follow-up, and the answer starts from this question.
Got a different question?Ask your own question
More Physics Questions
QCalculate the acceleration shown by each of the graphs below.QSketch a graph of velocity against time for the above motion. (3 marks)QHow can I represent the provided time and velocity data in graphical form?QThe distance -time graph below shows the journey of a car. Convert the the distance -time graph to…QThe diagram below shows the velocity-time graph of a body. The acceleration of the body in the…
Browse by topic:Mechanics
Handwritten Step-by-Step Solution
Get this as a handwritten image on WhatsApp — like a tutor wrote it for you.
Try on WhatsApp