
This physics problem tests your understanding of fundamental physical laws and their applications. The step-by-step solution below breaks down the problem using relevant equations and physical reasoning.
ScanSolve AI Answer
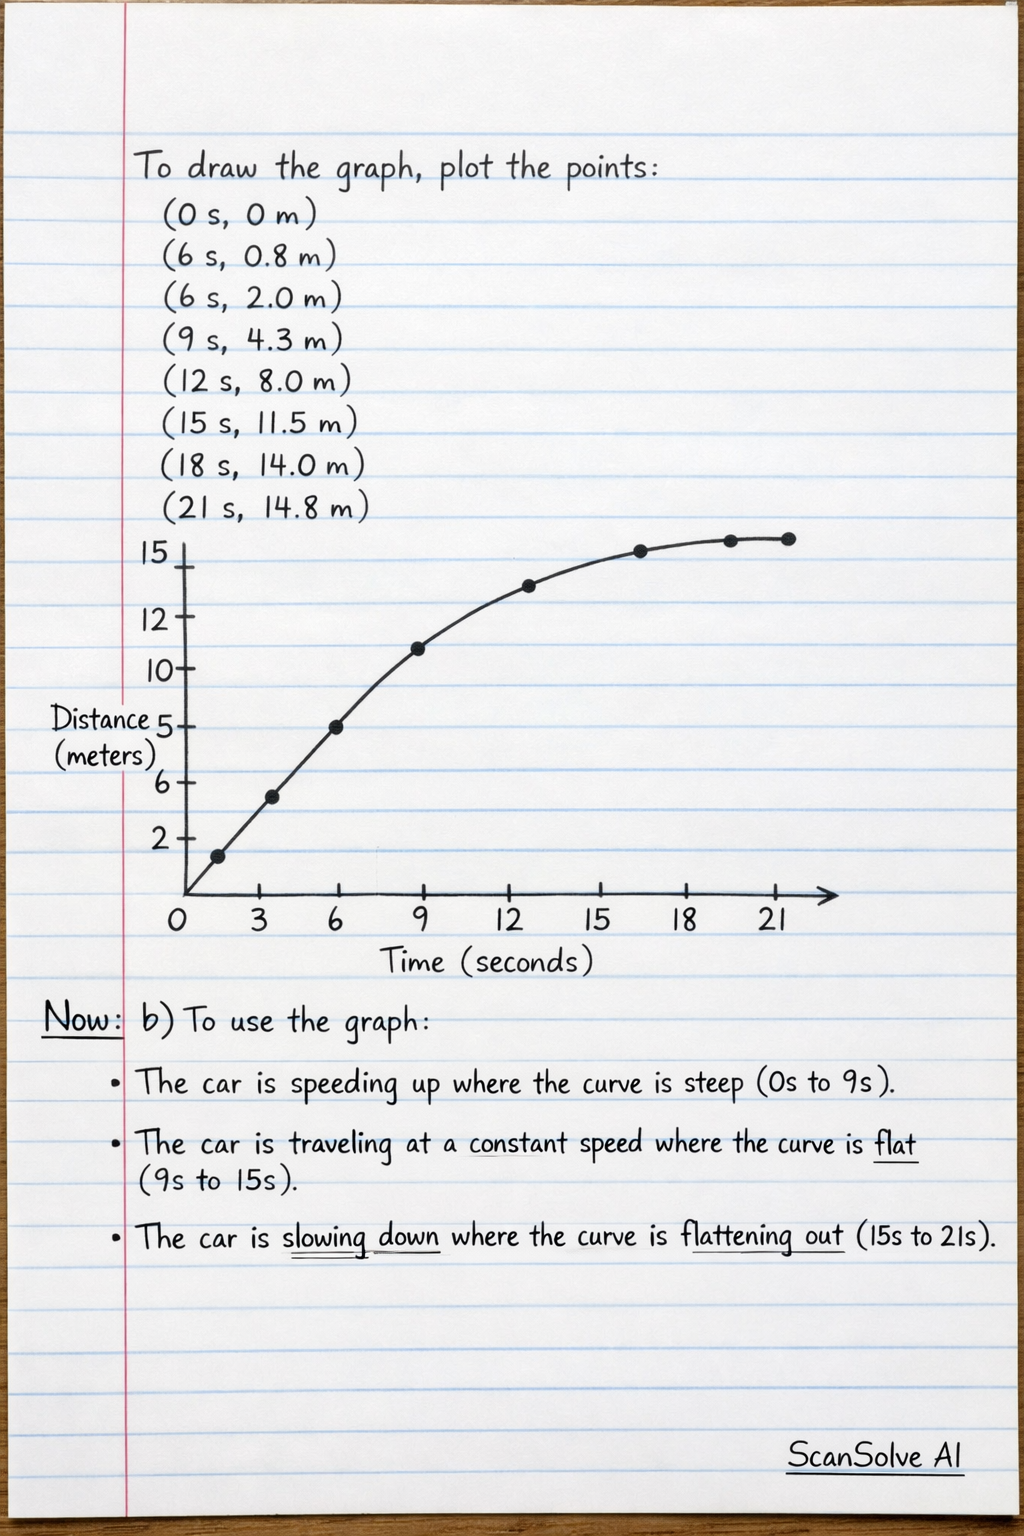
here's the solution to the next part: a) Draw a graph of the distance (Y-axis) against time (X-axis) using the information in the table. Both axes of your graph should start at zero. To draw the graph, plot the following points from the table: • (0 \, s, 0 \, m) • (3 \, s, 0.8 \, m) • (6 \, s, 2.0 \, m) • (9 \, s, 4.3 \, m) • (12 \, s, 8.0 \, m) • (15 \, s, 11.5 \, m) • (18 \, s, 14.0 \, m) • (21 \, s, 14.8 \, m) The X-axis (time) should be labeled from 0 \, s to at least 21 \, s, and the Y-axis (distance) from 0 \, m to at least 14.8 \, m. Connect these points with a smooth curve. The curve will initially be steep, indicating increasing speed, and then become flatter, indicating decreasing speed. b) Explain how you would use the graph to determine where the car is speeding up (acceleration), where it is traveling at constant speed, and where it is slowing down (deceleration). On a distance-time graph, the gradient (slope) of the curve represents the speed of the car. • The car is speeding up (accelerating) when the gradient of the curve is increasing (the curve gets steeper). • The car is traveling at constant speed when the gradient of the curve is constant (the curve is a straight line). • The car is slowing down (decelerating) when the gradient of the curve is decreasing (the curve gets flatter). What's next?