
We read your photo as:
The graph below illustrates the speed of a car in a period of 16 seconds as it drives along a gravelled road. (a) Find (i) the speed of the car when t = 4, (ii) the acceleration when t = 12. (b) Calculate the total distance travelled during the 16 seconds.
ScanSolve AI Answer
Answers
3 partsStep-by-step solution
8 stepsPart a(i)· 2 steps
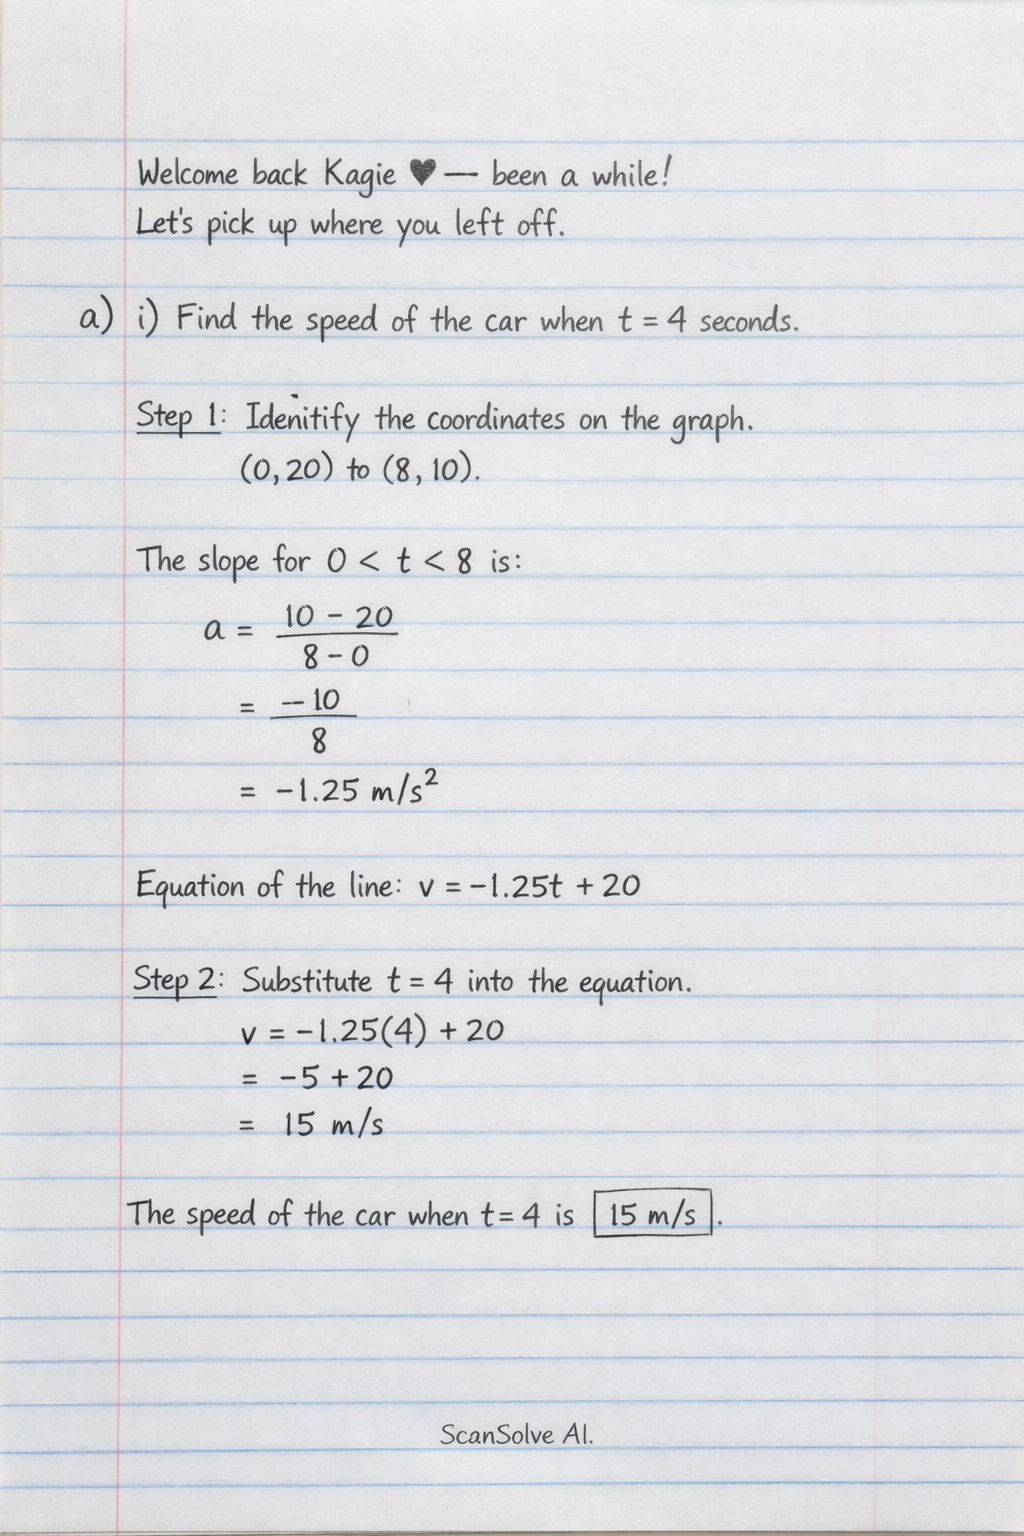
The speed of the car when seconds.
Identify the coordinates on the graph.
The graph is a straight line from to . To find the speed at , we can find the equation of this line or use similar triangles/interpolation.
The slope (acceleration) for is:The equation of the line is .
Substitute into the equation.
The speed of the car when is .
Part a(ii)
The acceleration when seconds.
Identify the section of the graph for .
For the time interval , the graph is a horizontal line at a constant speed of .
Calculate the acceleration.
Acceleration is the gradient of the speed-time graph. Since the speed is constant, the gradient is zero.
The acceleration when is .
Part b
Calculate the total distance travelled during the 16 seconds.
The total distance travelled is the area under the speed-time graph.
The area can be divided into two parts: a trapezium from to and a rectangle from to .
Calculate the area of the trapezium ().
The parallel sides are (at ) and (at ). The height is .
Calculate the area of the rectangle ().
The width is . The height (speed) is .
Calculate the total distance.
The total distance travelled during the 16 seconds is .
Try one yourself
A new problem that tests the same skill.
Still stuck on this one?
Ask a follow-up, and the answer starts from this question.
More Physics Questions
Handwritten Step-by-Step Solution
Get this as a handwritten image on WhatsApp — like a tutor wrote it for you.
Try on WhatsApp