
We read your photo as:
Use Table 1.2 to plot a graph of T on the y-axis and m on the x-axis. Draw a straight line of best fit. A student suggests that the mass m of the bob is directly proportional to the period T. State whether the readings support this suggestion. Justify your answer by reference to the graph line.
Physics
ScanSolve AI Answer
Here are the solutions to the questions:
Question 1 (d):
-
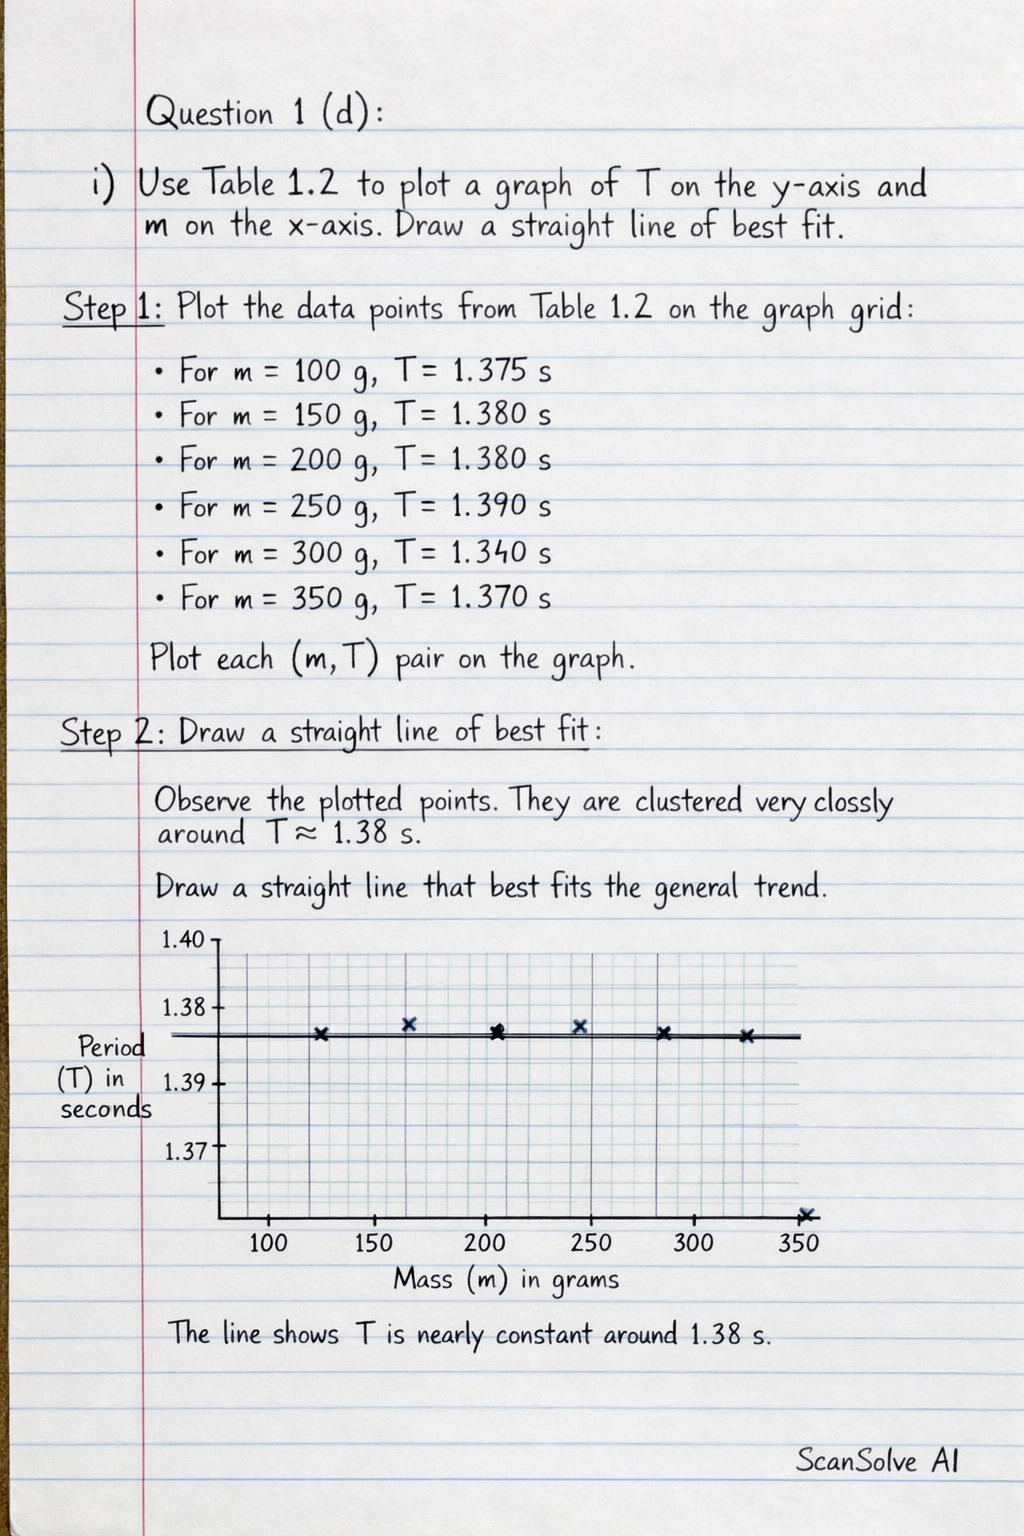
i) Use Table 1.2 to plot a graph of T on the y-axis and m on the x-axis. Draw a straight line of best fit.
- Step 1: Plot the data points from Table 1.2 on the graph grid.
- For ,
- For ,
- For ,
- For ,
- For ,
- For , Plot each pair as a distinct point on the graph.
- Step 2: Draw a straight line of best fit. Observe the plotted points. They are clustered very closely around . Draw a straight line that best represents the general trend of these points. This line will be approximately horizontal, indicating that the period is largely independent of the mass .
- Step 1: Plot the data points from Table 1.2 on the graph grid.
-
ii) A student suggests that the mass of the bob is directly proportional to the period . State whether the readings support this suggestion. Justify your answer by reference to the graph line.
- Statement: The readings do not support the suggestion.
- Justification: For mass to be directly proportional to the period (), the graph of against must be a straight line that passes through the origin . From the plotted graph, the line of best fit is approximately horizontal, indicating that remains relatively constant as changes. If this line were extrapolated back to , it would intersect the T-axis at approximately , not 0. Therefore, is not directly proportional to .
Was this helpful?
Still stuck on this one?
Ask a follow-up, and the answer starts from this question.
Got a different question?Ask your own question
More Physics Questions
QA student is performing an experiment with a helical spring and collecting data for the period T and…QUsing the provided graph, determine the relationship between the square of the period and the mass…QThe relationship between mass (m) and the square of the period (T2) for a single spring is given by…QPlot a graph of M on the vertical axis and T 2 on the horizontal axis, starting both axes from the…QDetermine the period (T) of the wave from the graph.
Handwritten Step-by-Step Solution
Get this as a handwritten image on WhatsApp — like a tutor wrote it for you.
Try on WhatsApp