
We read your photo as:
Calculate the work done from a Force-Distance graph given specific points. What is the area under the graph?
Physics
ScanSolve AI Answer
Step-by-step solution
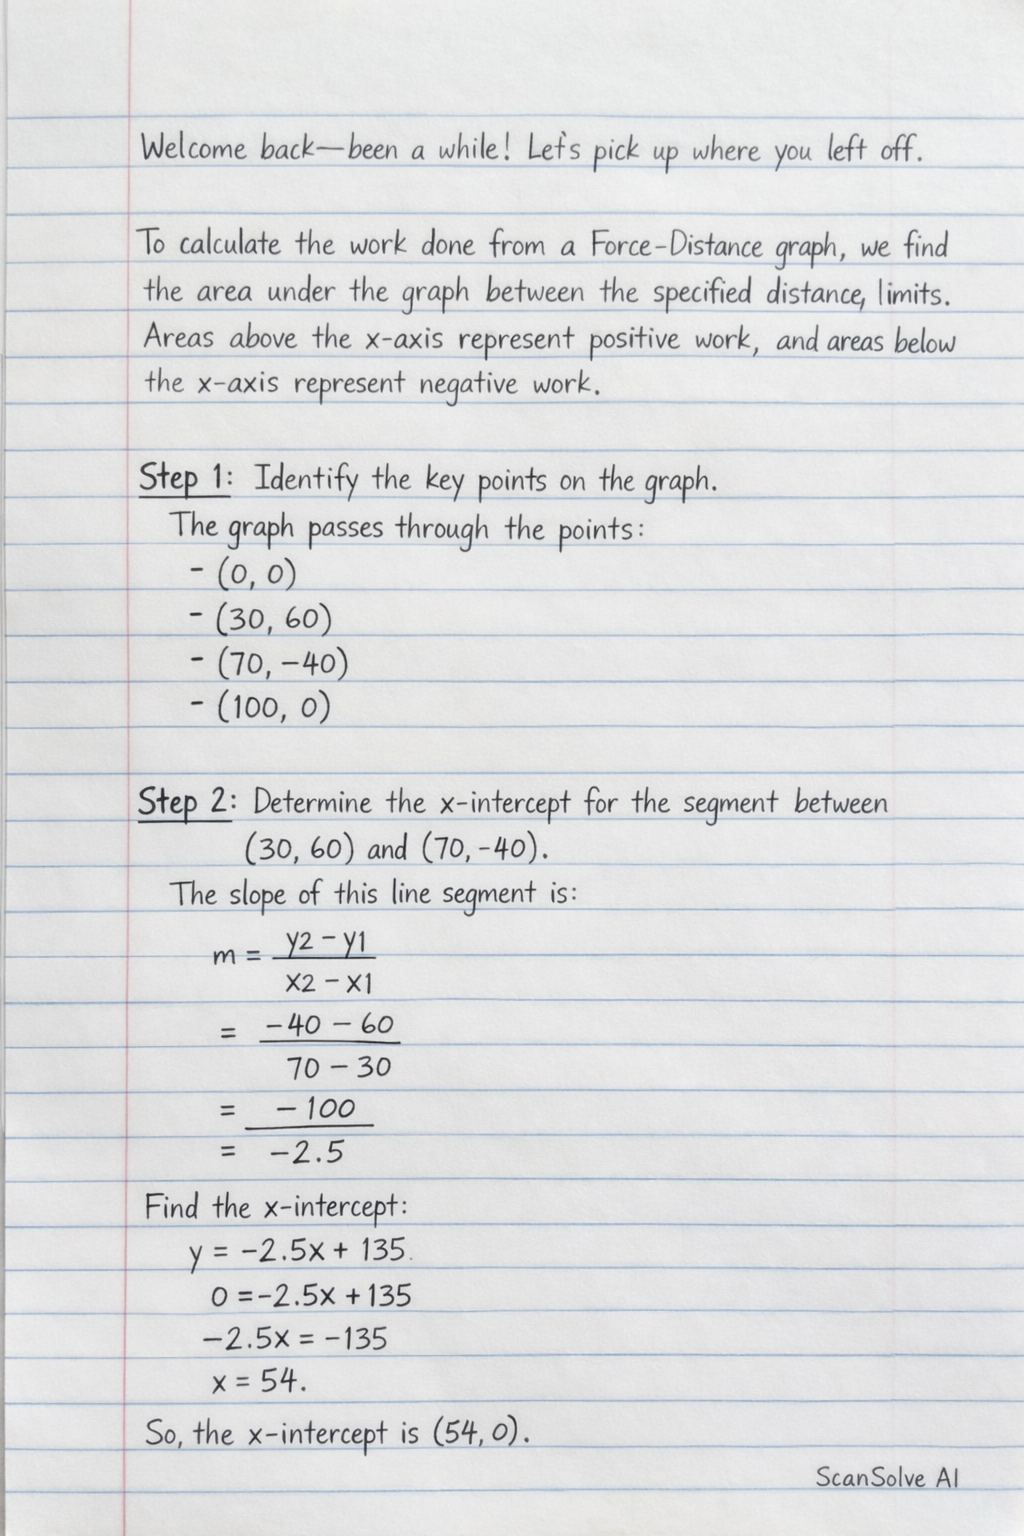
2 stepsTo calculate the work done from a Force-Distance graph, we find the area under the graph between the specified distance limits. Areas above the x-axis represent positive work, and areas below the x-axis represent negative work.
Identify the key points on the graph.
The graph passes through the points:
Determine the x-intercept for the segment between and .
The slope of this line segment is $
Was this helpful?
Still stuck on this one?
Ask a follow-up, and the answer starts from this question.
Got a different question?Ask your own question
More Physics Questions
QCalculate the work done by the electric force.QCalculate the work done by a force of 20 N applied over a distance of 40 m.QDefine the formula for work done by a constant force.QCalculate the work done against gravity and the work done by an applied force when moving a trolley…QA motor supplies a constant force of 1 kN which is used to move a load a distance of 5 m. The force…
Browse by topic:Mechanics
Handwritten Step-by-Step Solution
Get this as a handwritten image on WhatsApp — like a tutor wrote it for you.
Try on WhatsApp