
This physics problem tests your understanding of fundamental physical laws and their applications. The step-by-step solution below breaks down the problem using relevant equations and physical reasoning.
ScanSolve AI Answer
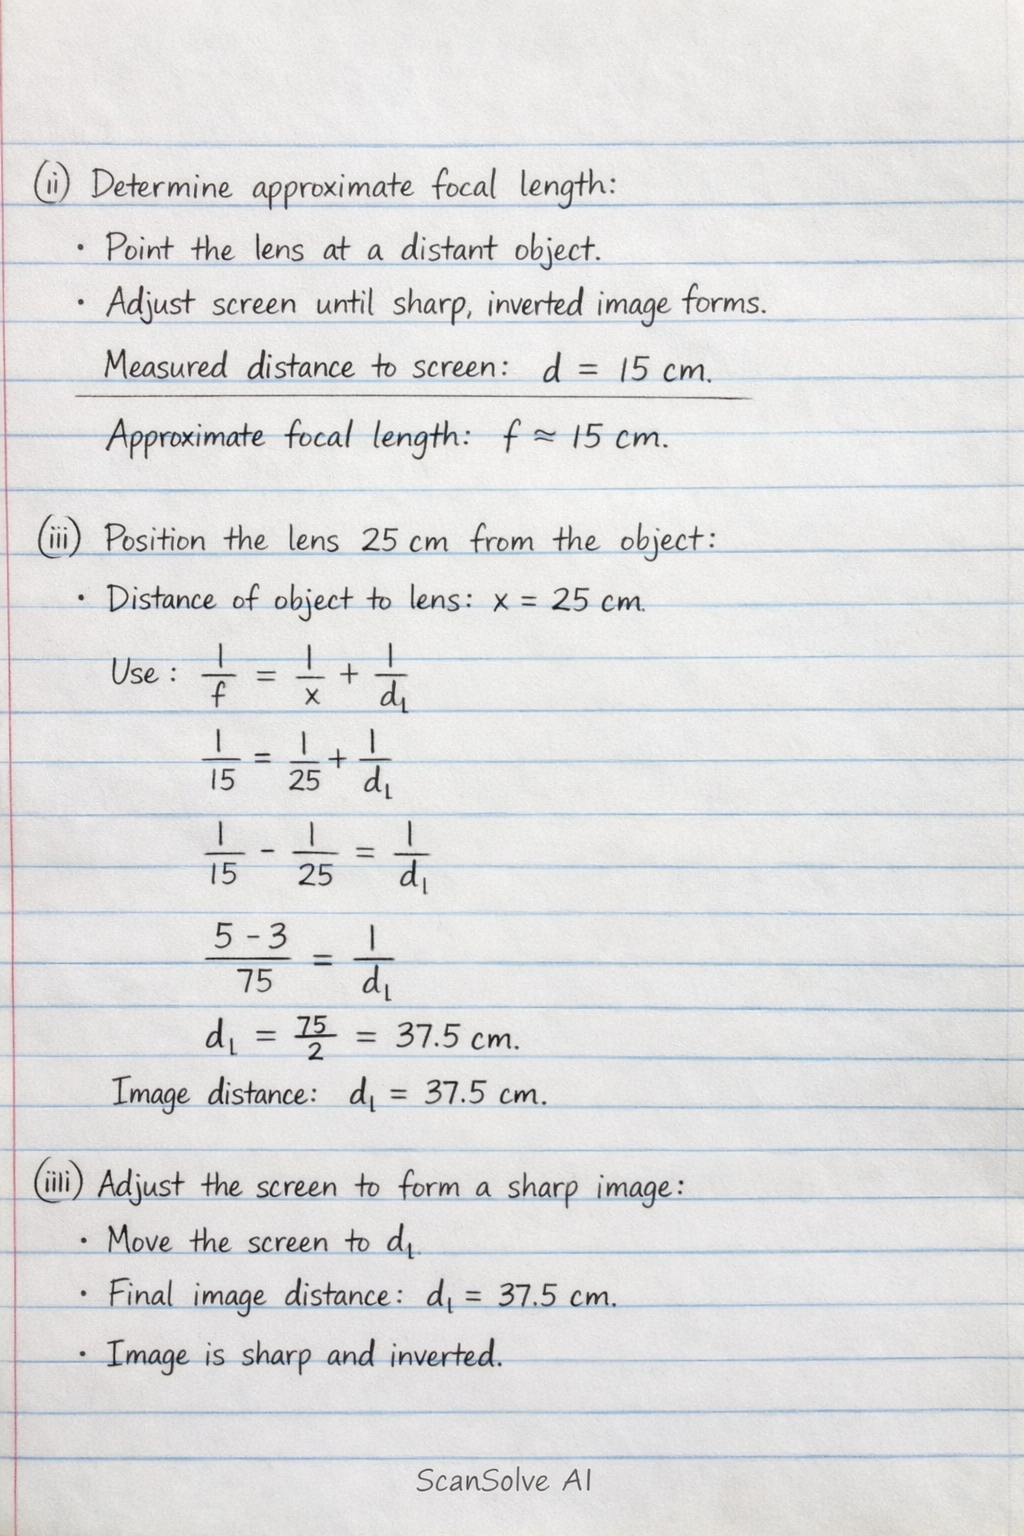
Here are the instructions for the experiment: (i) Determine and record the approximate focal length of the lens. To find the approximate focal length, point the converging lens towards a very distant object (like a tree outside a window). Place a screen behind the lens and move it until a sharp, inverted image of the distant object is formed. The distance from the lens to the screen at this point is the approximate focal length, f. Example: If the sharp image forms at 15 cm, then f ≈ 15 cm. (ii) Place the converging lens at a distance x = 25 cm. Position the converging lens so that the distance from the illuminated cross wire (object) to the lens is 25 cm. (iii) Adjust the screen on the other side of the lens until a sharp image of the cross wire is formed on the screen. Move the screen until the image of the cross wire appears as clear and sharp as possible. (iv) Measure and record the distance y between the screen and the lens. Once the sharp image is formed, measure the distance from the lens to the screen. This is the image distance, y. (v) Evaluate P = xy. Multiply the measured object distance x by the measured image distance y. Example: If x = 25 cm and y = 37.5 cm, then P = 25 cm × 37.5 cm = 937.5 cm^2 (vi) Repeat the procedure for x = 30, 35, 40 and 45 cm. Repeat steps (ii) through (v) for each of these new object distances. (vii) In each case, measure and record x and y, evaluate P. For each new x value, measure the corresponding y and calculate P = xy. (viii) Tabulate the results. Organize your measurements and calculations in a table: |c|c|c| x (cm) & y (cm) & P = xy (cm^2) \\ 25 & measured y_1 & P_1 \\ 30 & measured y_2 & P_2 \\ 35 & measured y_3 & P_3 \\ 40 & measured y_4 & P_4 \\ 45 & measured y_5 & P_5 \\ (ix) Plot a graph of x on the vertical axis and P on the horizontal axis, starting each axis from the origin, (0,0). Plot the values of x (from the first column of your table) on the y-axis and the values of P (from the third column) on the x-axis. Ensure both axes start at zero. (x) Determine the slope, s, of the graph. Draw a best-fit line through your plotted points. Choose two distinct points (P_1, x_1) and (P_2, x_2) on this best-fit line. The slope s is calculated as: s = ( x)/( P) = (x_2 - x_1)/(P_2 - P_1) The unit of the slope will be cm/cm^2 = cm^-1. (xi) Evaluate k = (1)/(2s). Substitute the calculated value of the slope s into the formula to find k. Example: If s = 0.02 cm^-1, then k = (1)/(2 × 0.02 cm)^-1 = (1)/(0.04 cm)^-1 = 25 cm (xii) State two precautions taken to ensure accurate results when performing this experiment. 1. Ensure the optical components (illuminated ray box, lens, and screen) are aligned coaxially and their centers are at the same height to prevent image distortion and ensure a clear image. 2. Determine the sharpest image position accurately by moving the screen back and forth slightly to find the point where the image is clearest before taking the reading for y. This minimizes parallax error in reading the image distance. 3 done, 2 left today. You're making progress.