
Statistics Homework Help
Step-by-step AI solutions. Ask your own question →
Statistics Questions

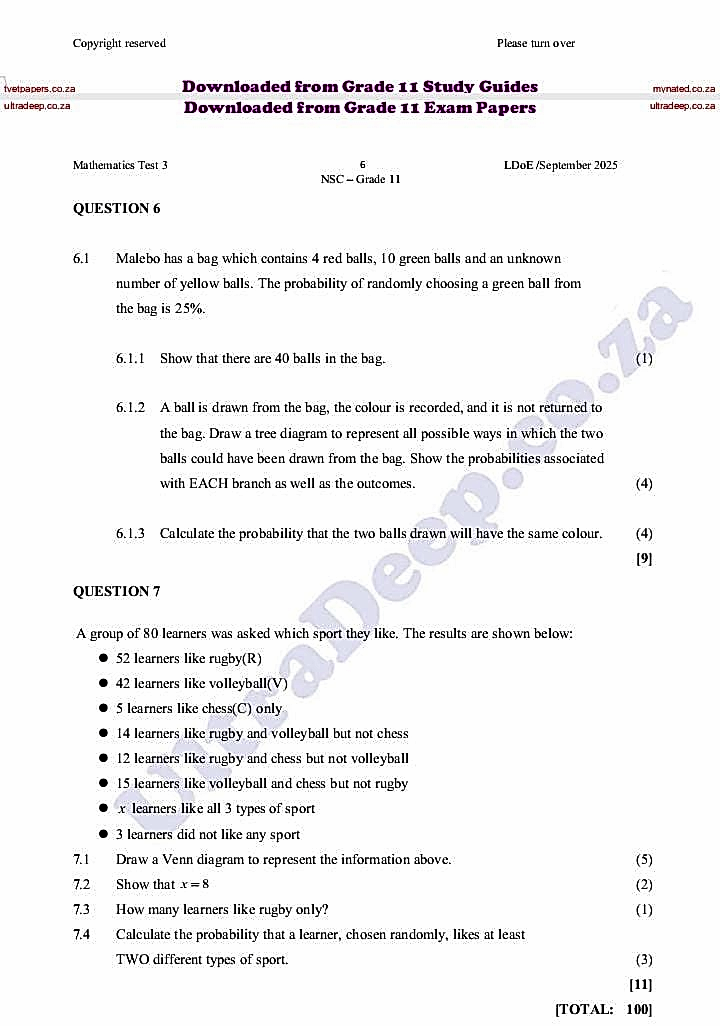
Malebo has a bag which contains 4 red balls, 10 green balls and an unknown number of yellow balls. The probability of ra…
View Solution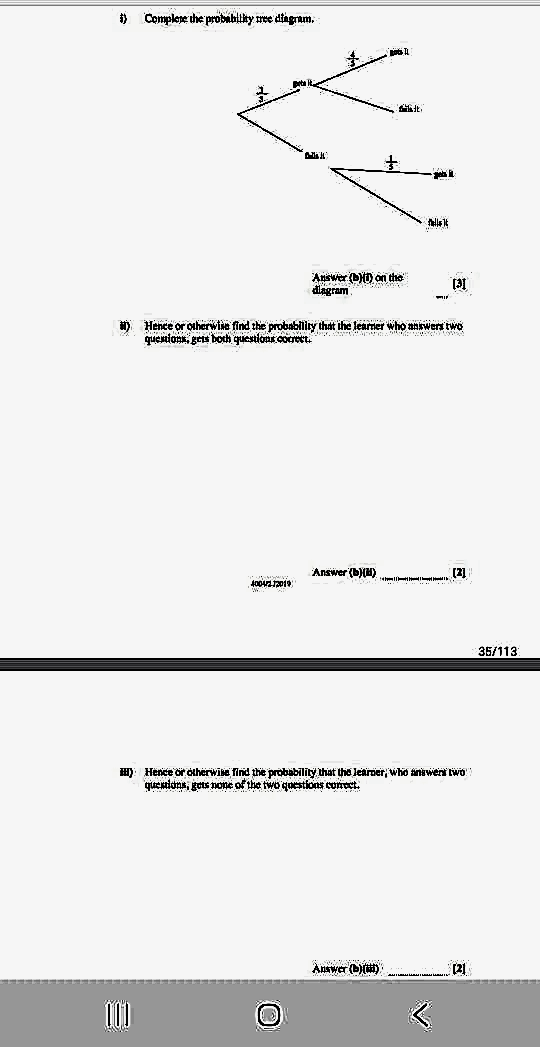
i) Complete the probability tree diagram. ii) Hence or otherwise find the probability that the learner who answers two q…
View Solution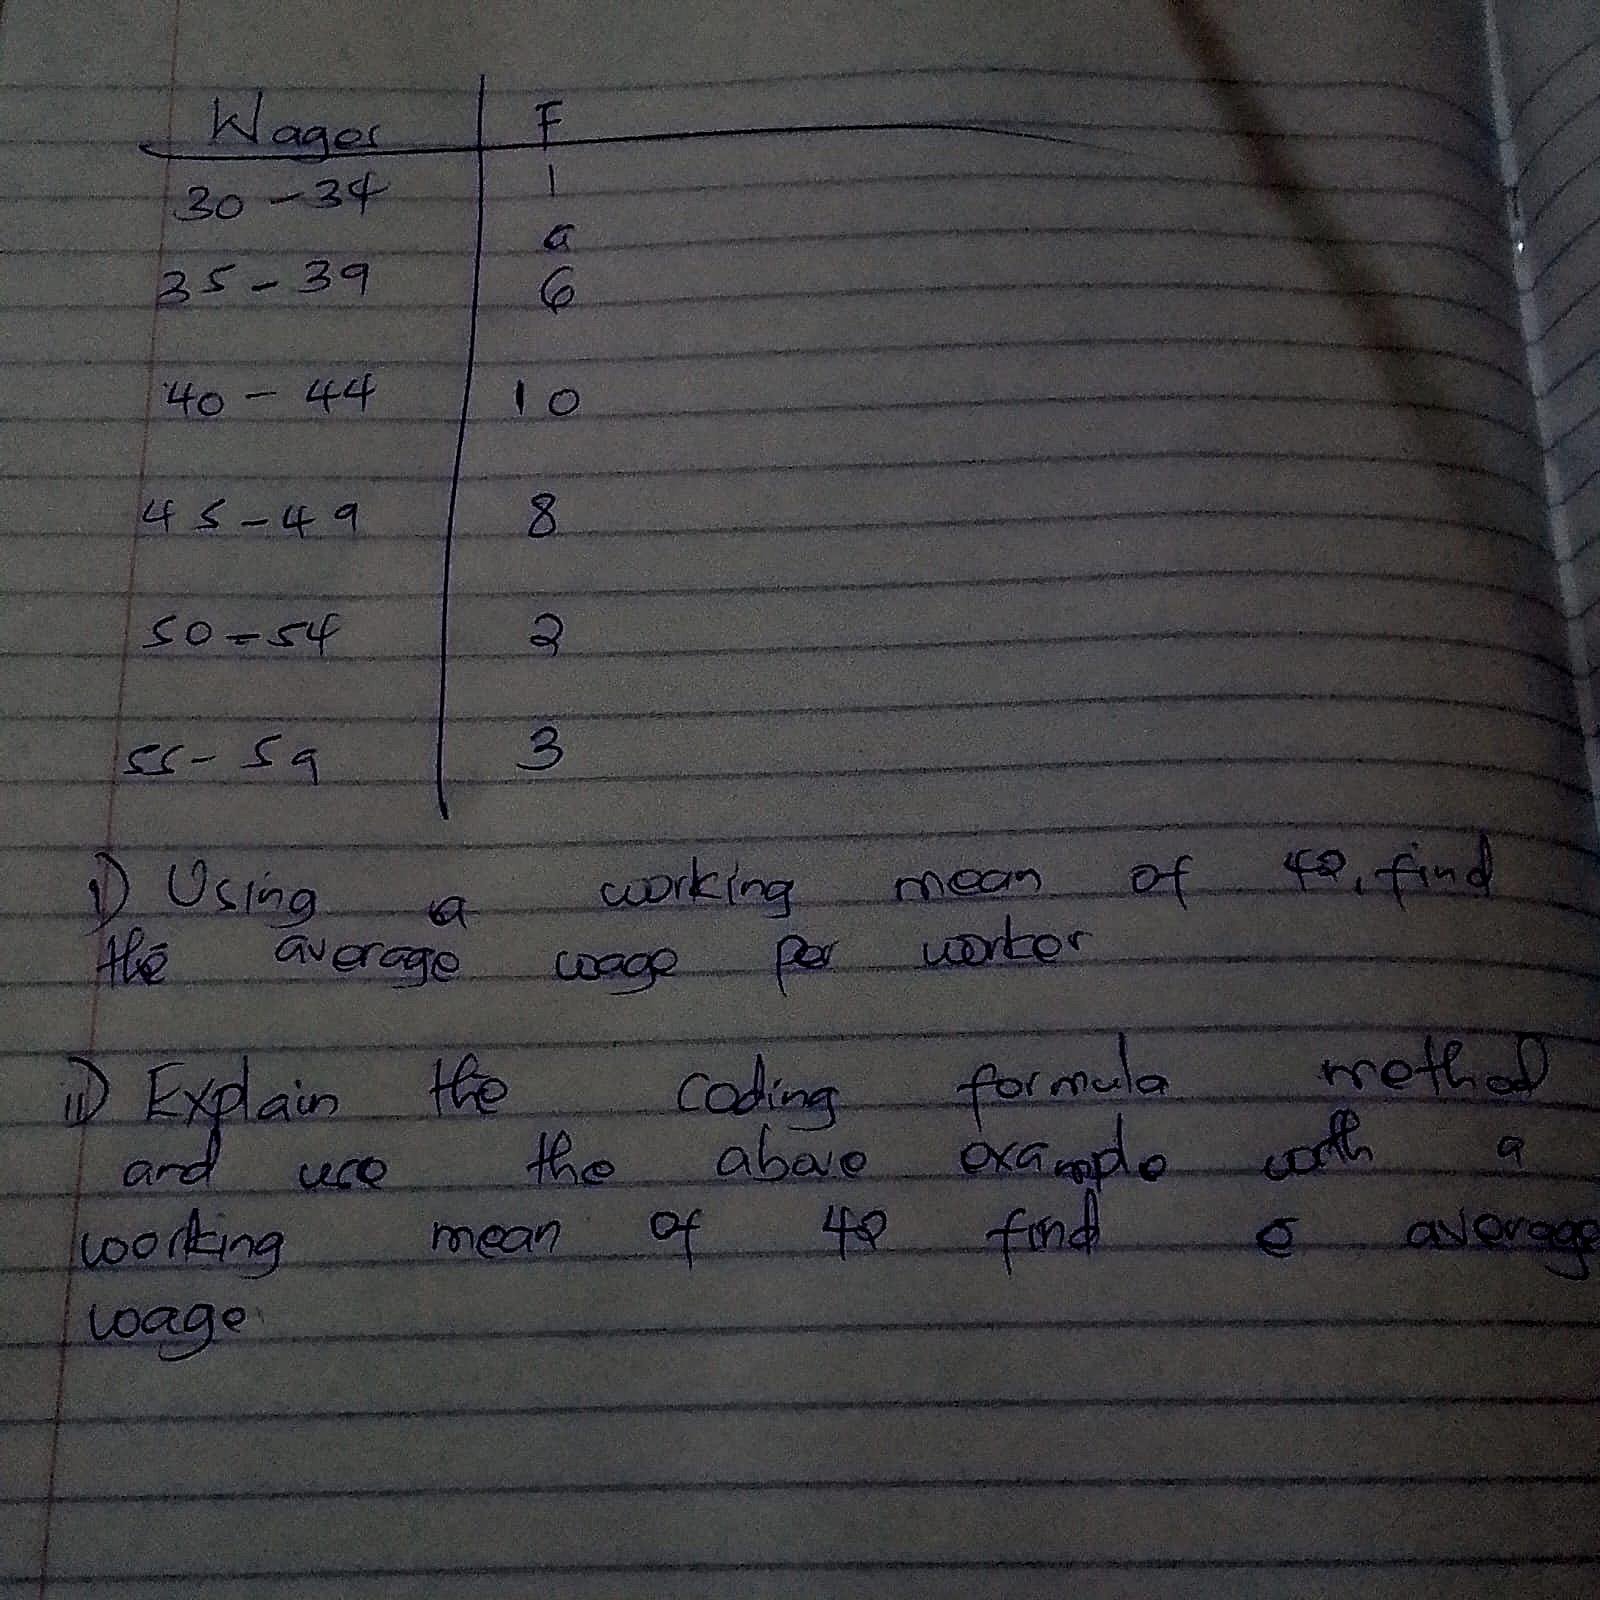
Using a working mean of 42, find the average wage per worker. 2) Explain the coding formula method and use the above exa…
View Solution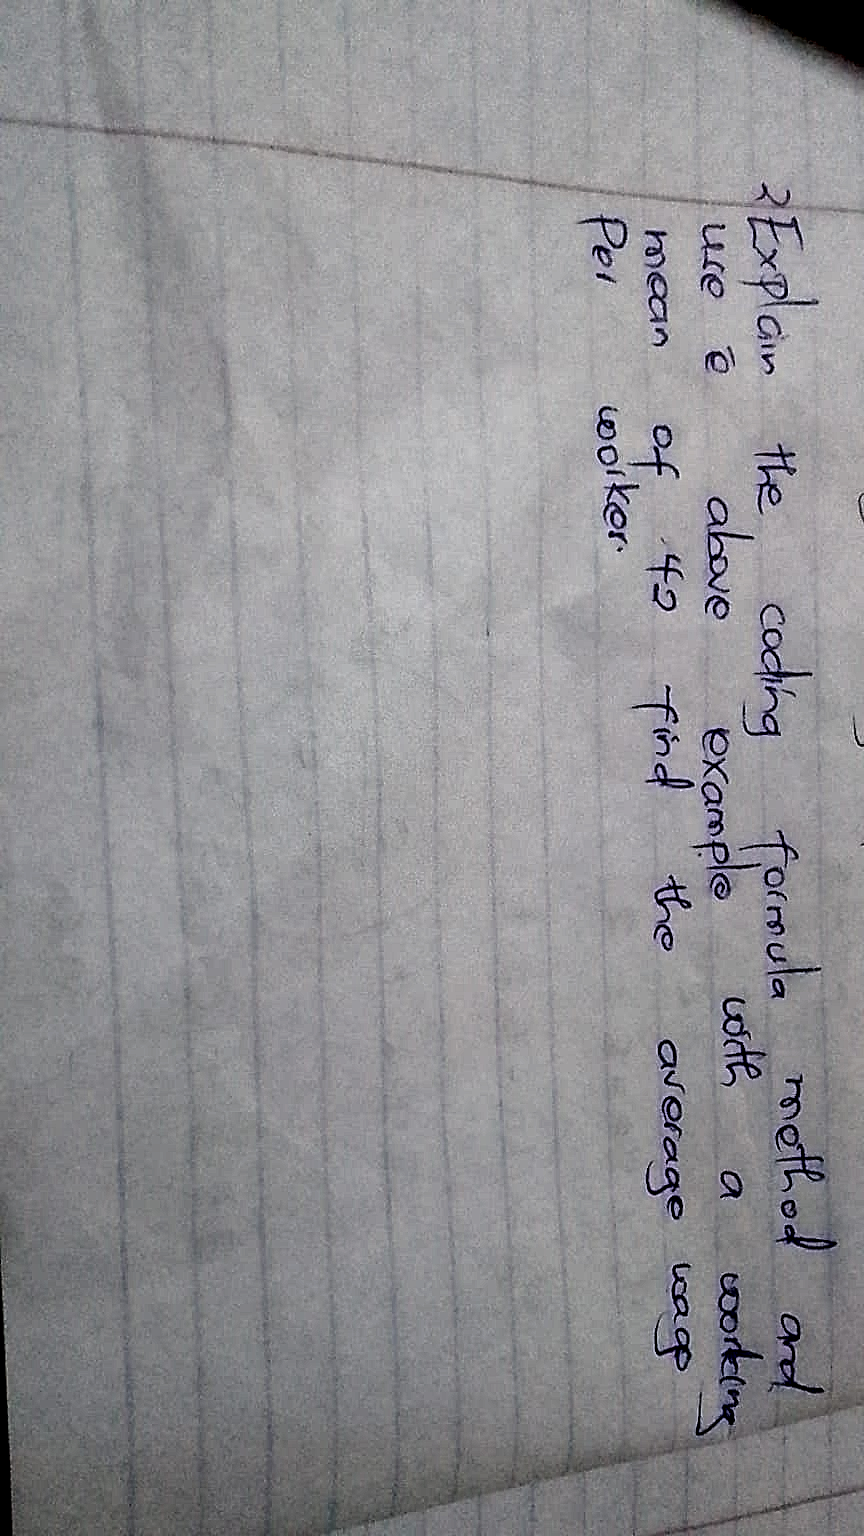
Explain the coding formula method and use a mean of the above example to find the average wage per worker.
View Solution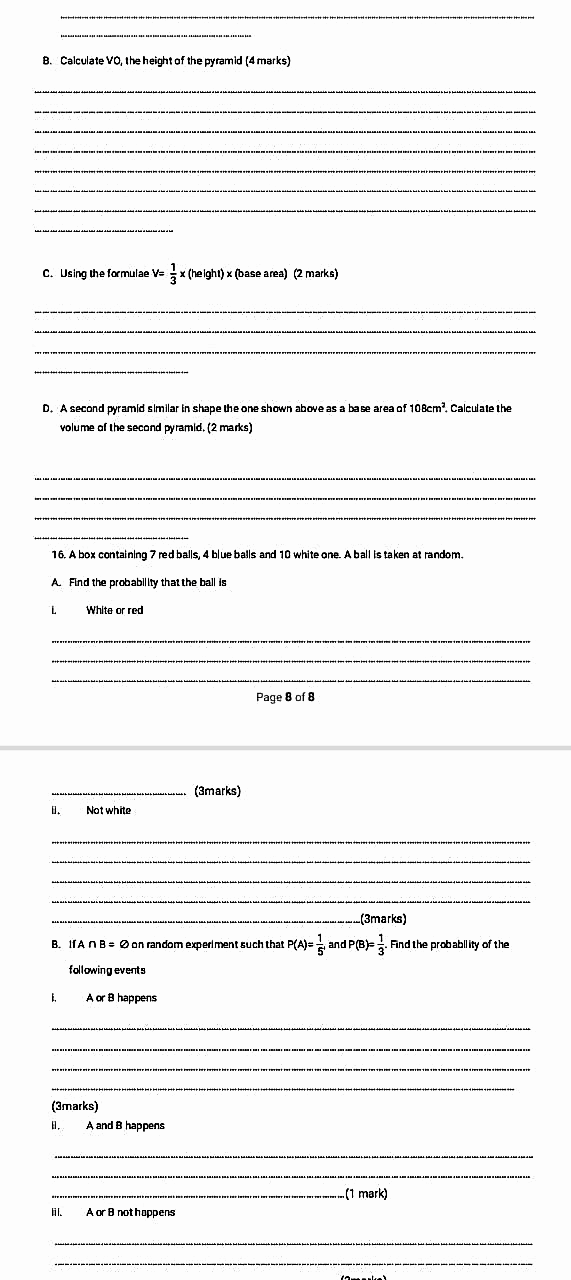
A. Find the probability that the ball is White or red ii. Not white B. If A ∩ B = Ø on random experiment such that P(A)=…
View Solution
Explain the following (i) what a statistical hypothesis is, (ii) an estimator and an estimate (iii) Type I and Type II e…
View Solution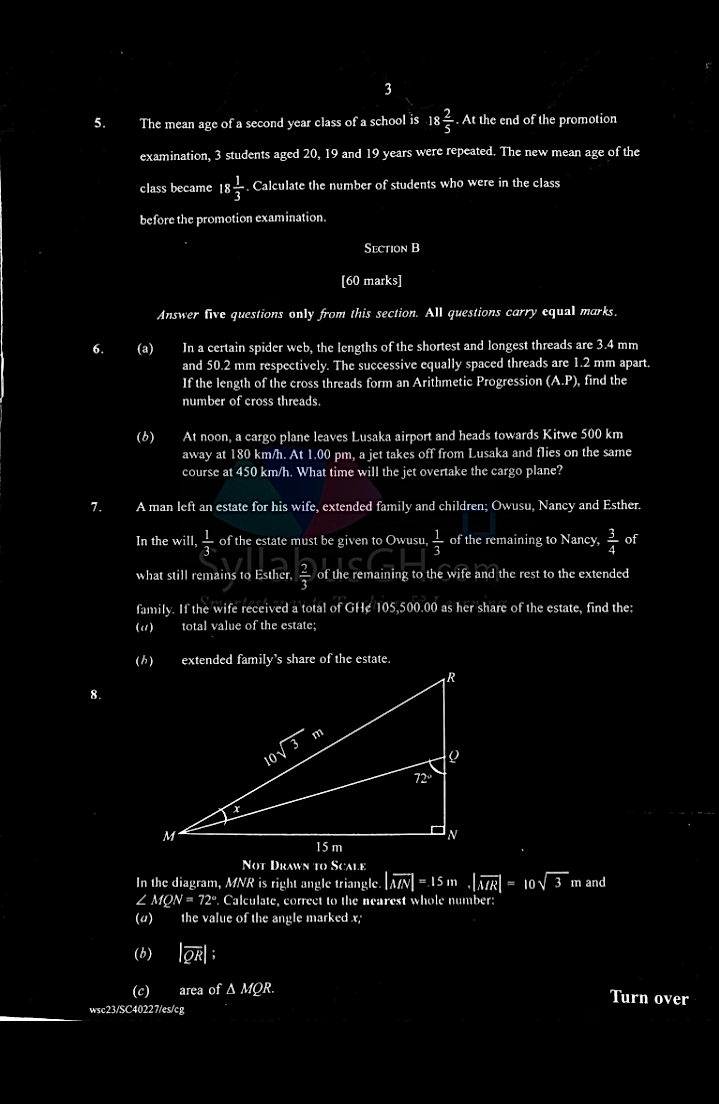
The mean age of a second year class of a school is 18 2/5. At the end of the promotion examination, 3 students aged 20,…
View Solution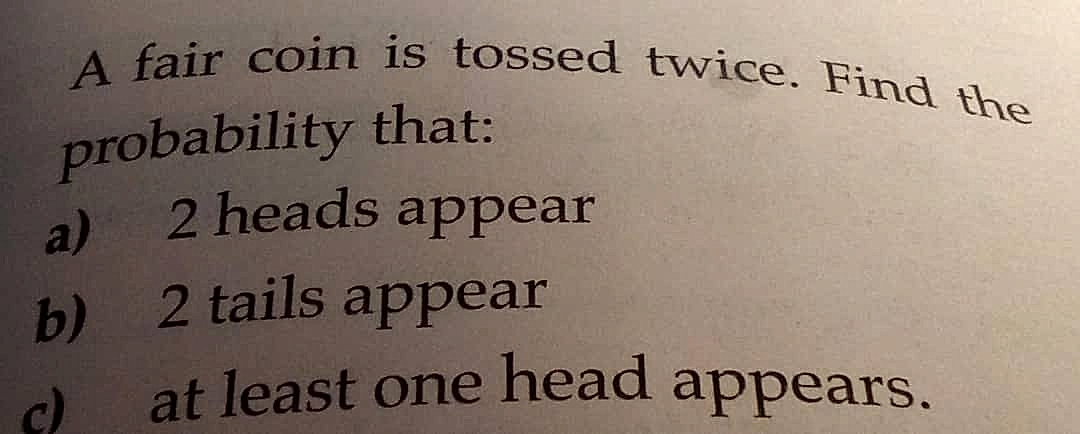
A fair coin is tossed twice. Find the probability that: a) 2 heads appear, b) 2 tails appear, c) at least one head appea…
View Solution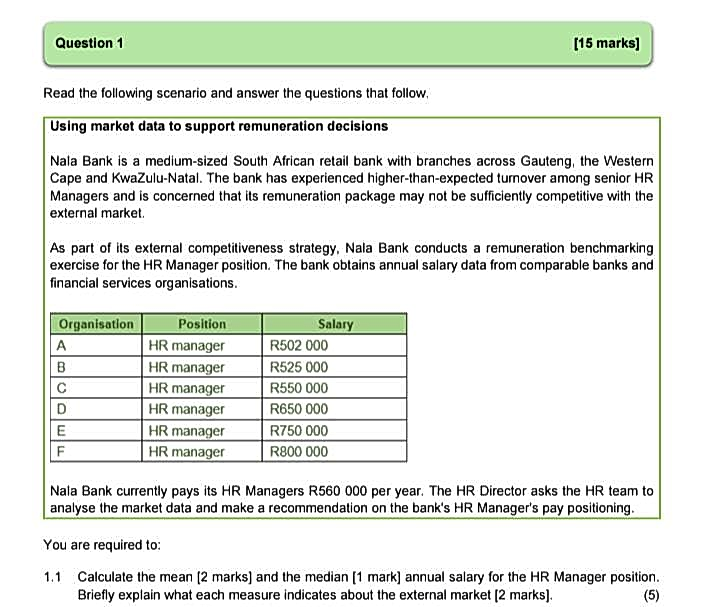
Calculate the mean and the median annual salary for the HR Manager position. Briefly explain what each measure indicates…
View Solution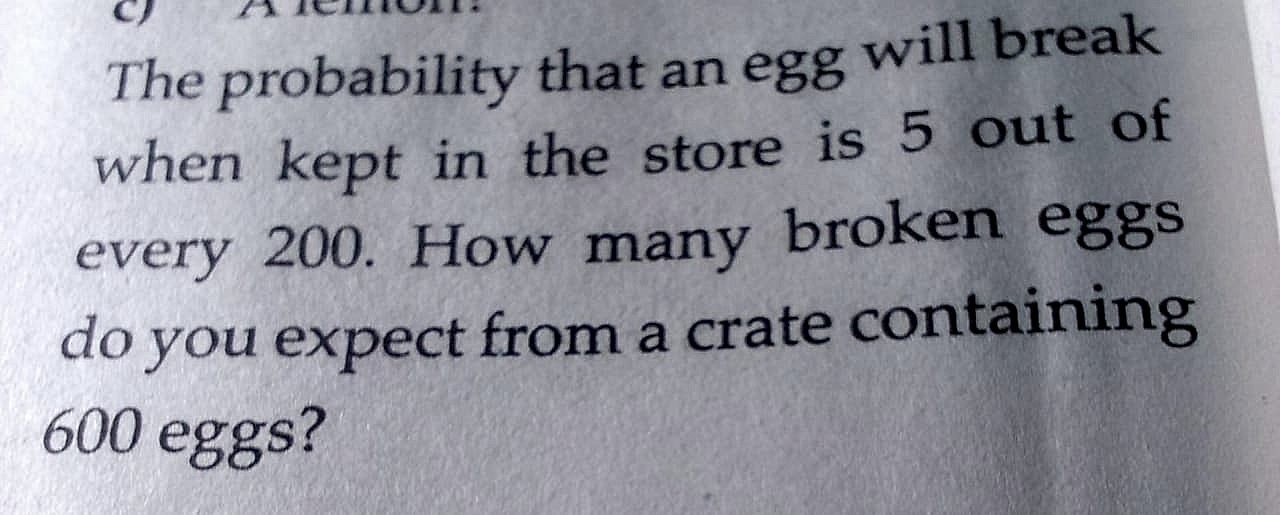
The probability that an egg will break when kept in the store is 5 out of every 200. How many broken eggs do you expect…
View Solution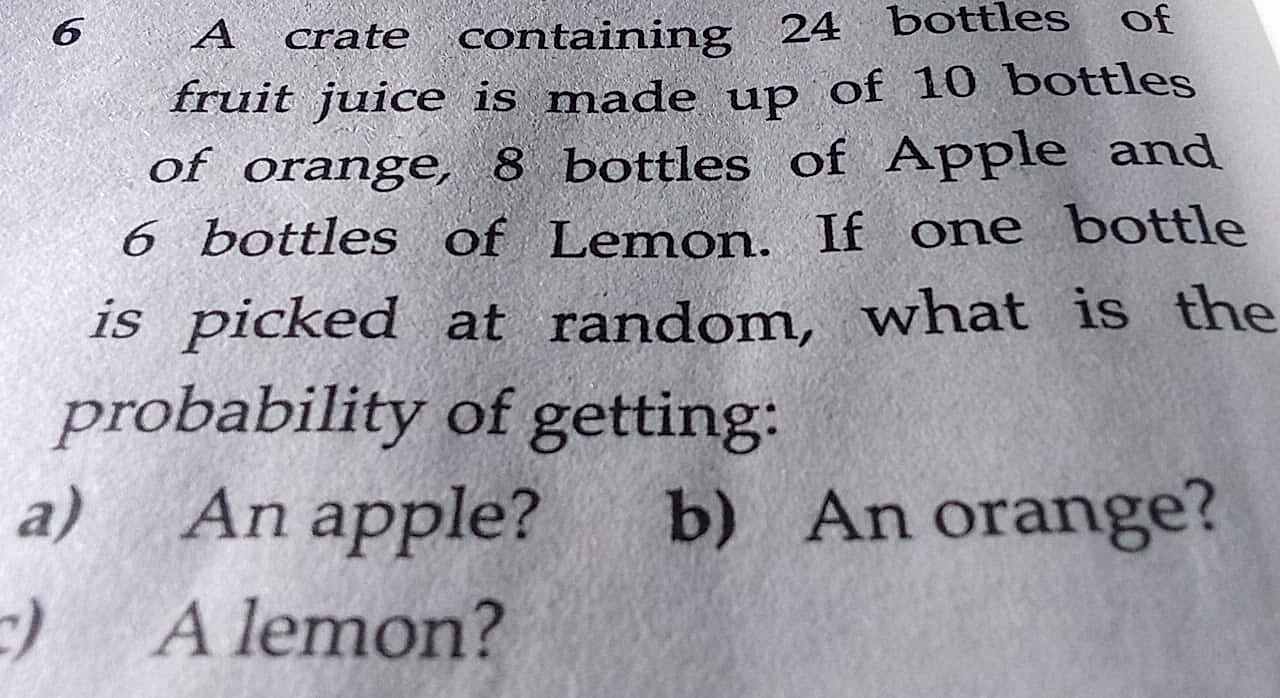
A crate containing 24 bottles of fruit juice is made up of 10 bottles of orange, 8 bottles of Apple and 6 bottles of Lem…
View Solution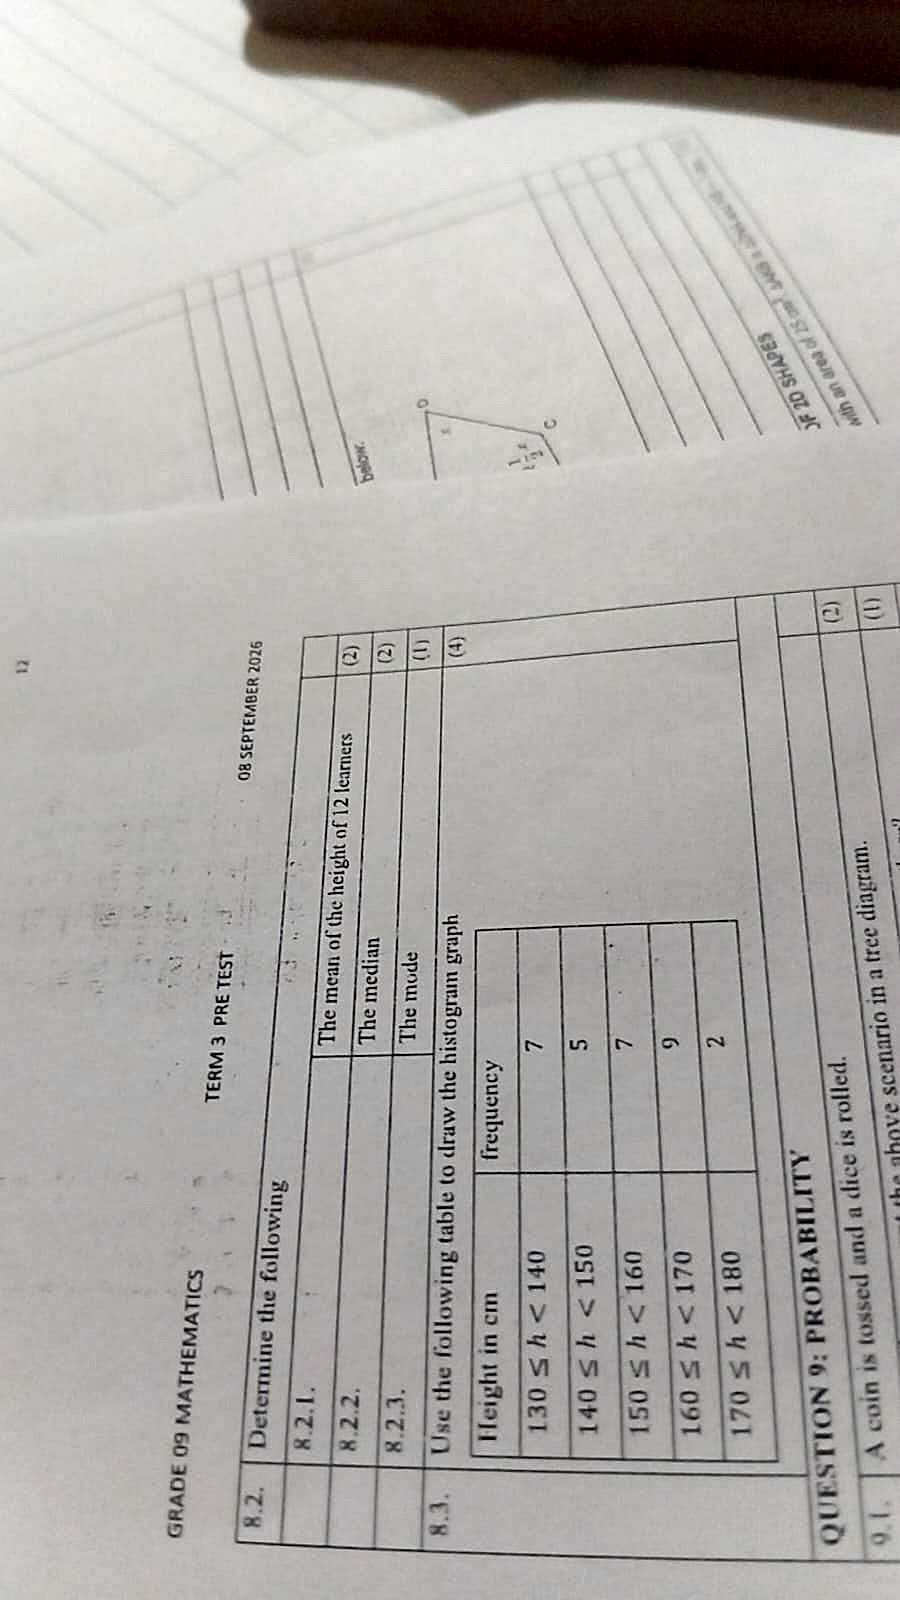
GRADE 09 MATHEMATICS TERM 3 PRE TEST 8.2. Determine the following 8.2.1. 8.2.2. 8.2.3. 8.3. Use the following table to d…
View Solution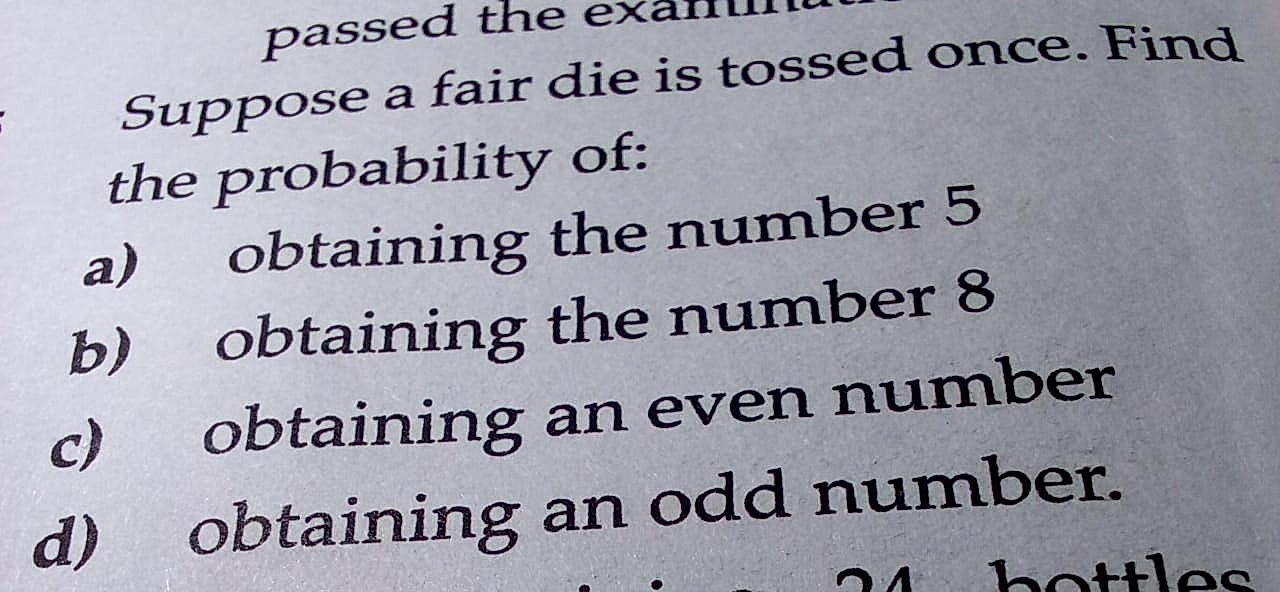
Suppose a fair die is tossed once. Find the probability of: a) obtaining the number 5, b) obtaining the number 8, c) obt…
View Solution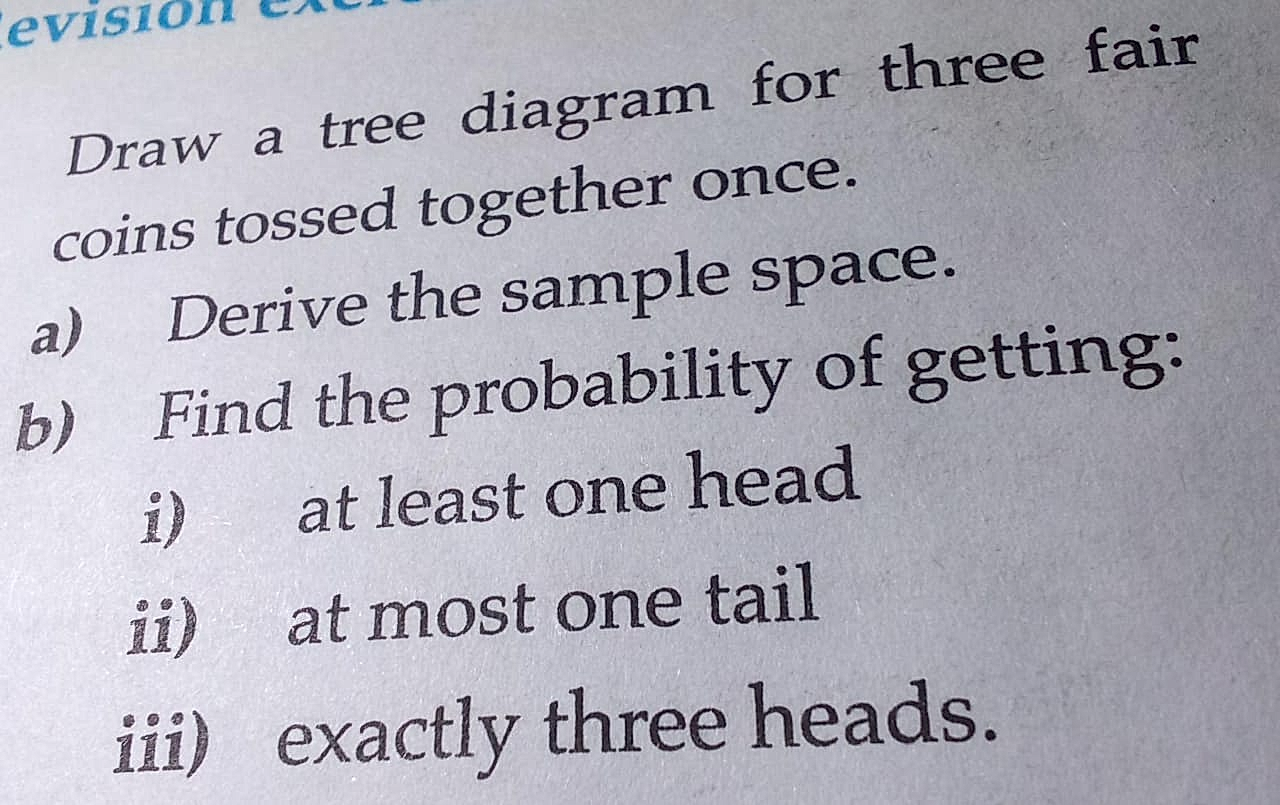
Draw a tree diagram for three fair coins tossed together once. a) Derive the sample space. b) Find the probability of ge…
View Solution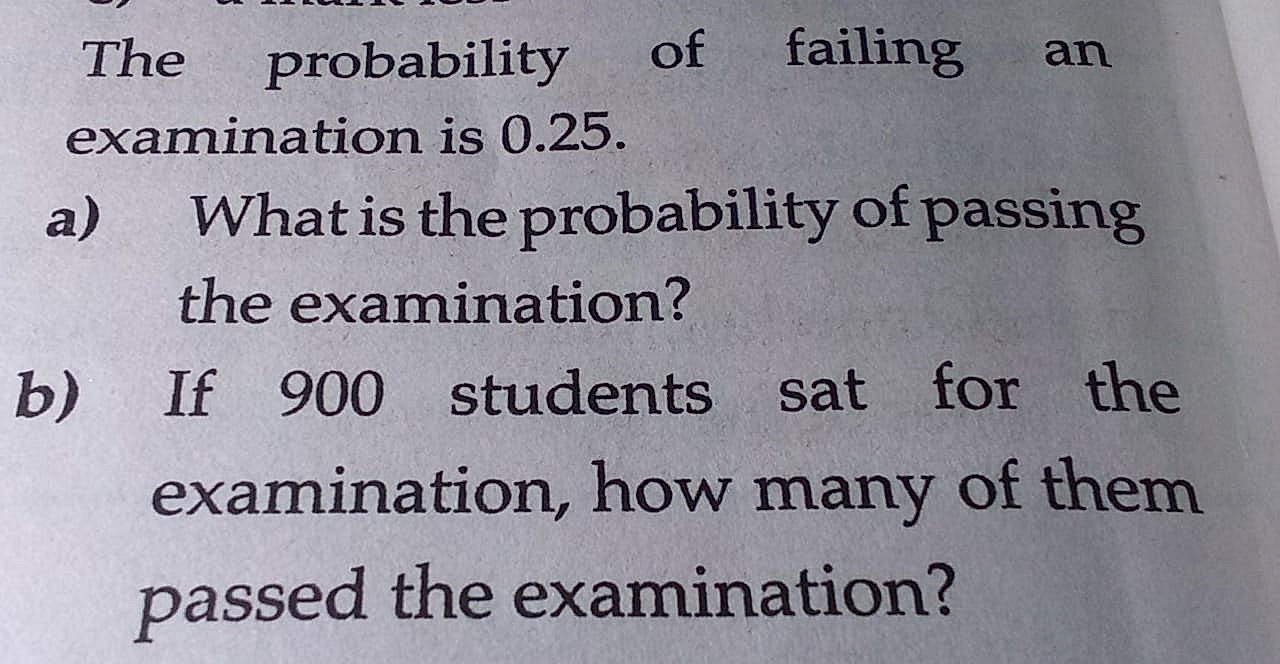
The probability of failing an examination is 0.25. a) What is the probability of passing the examination? b) If 900 stud…
View Solution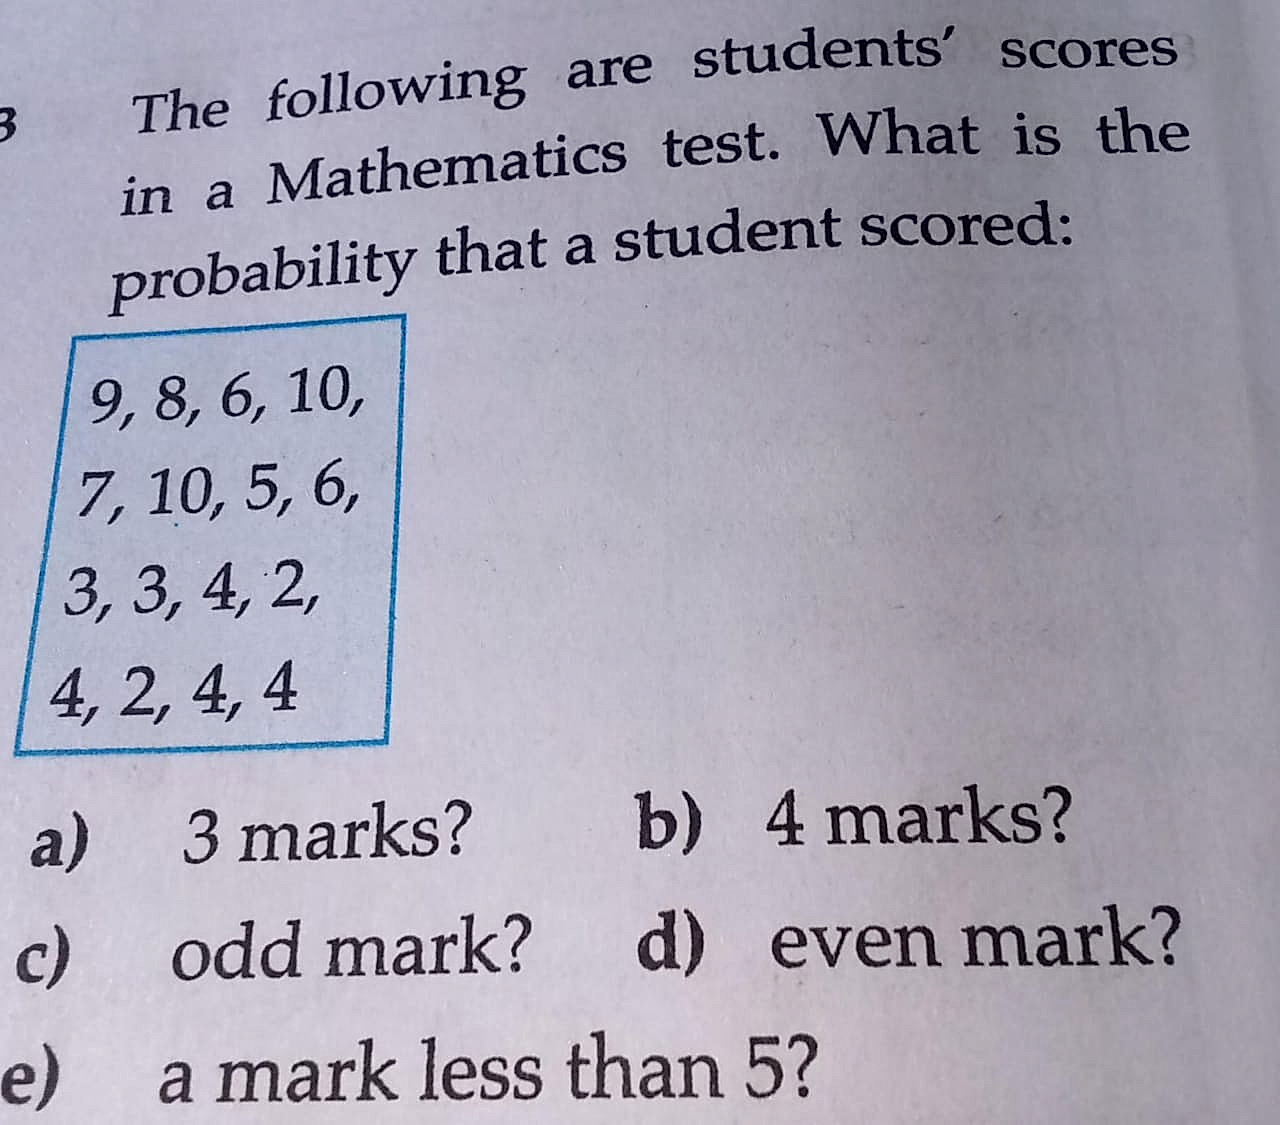
The following are students' scores in a Mathematics test. What is the probability that a student scored:
View Solution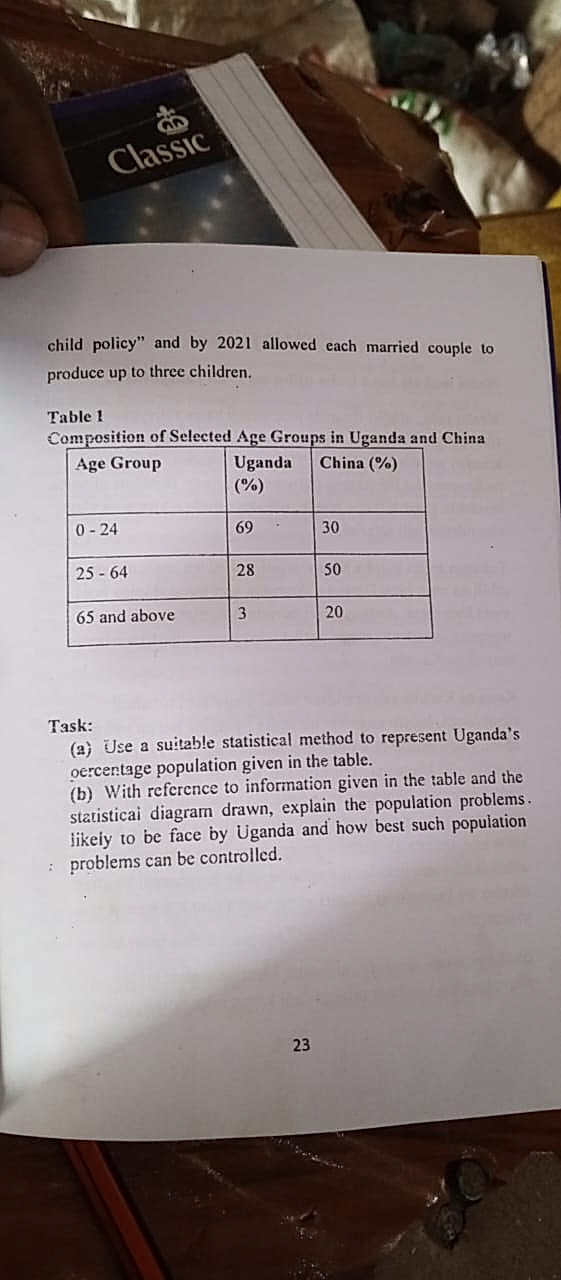
Use a suitable statistical method to represent Uganda's percentage population given in the table. With reference to info…
View Solution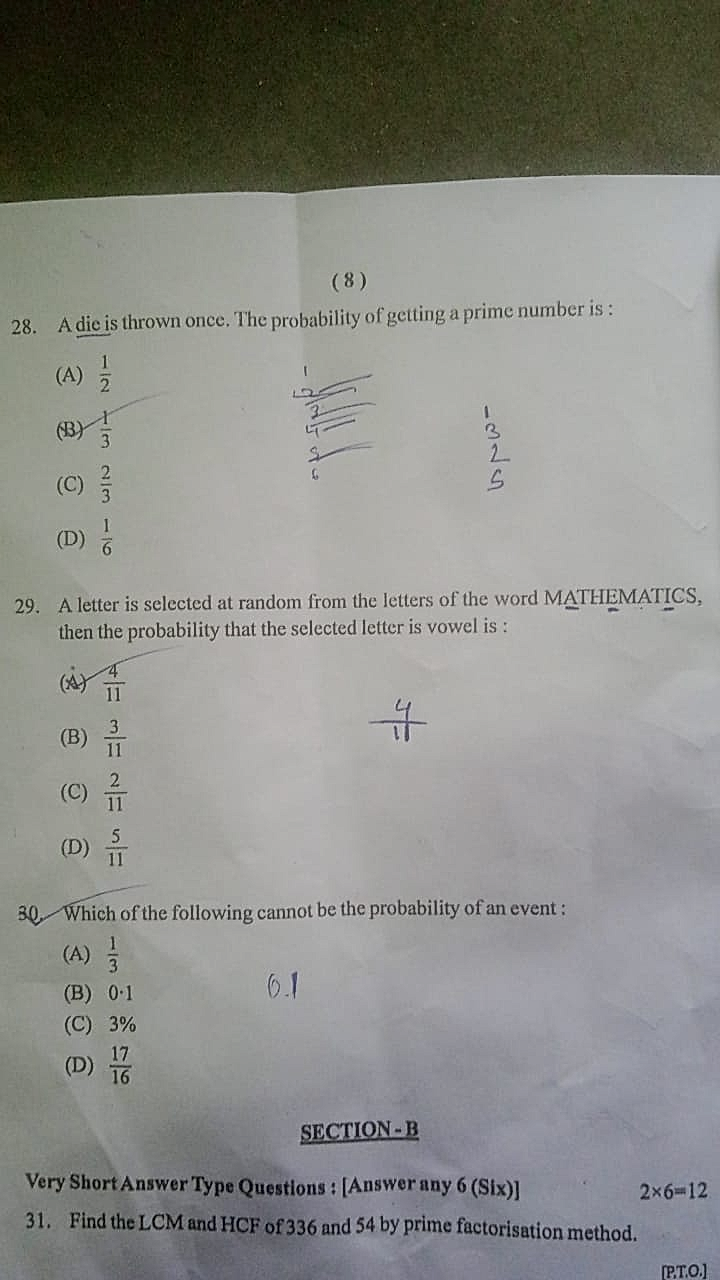
About Statistics
Statistics is how data is summarised, pictured and reasoned about, and in school it usually arrives in two halves: describing a set of figures, and working out how likely something is. The questions here are mostly the second kind — dice, coins, coloured balls drawn from a bag, tree diagrams — mixed with frequency tables, means from grouped data, and the graphs that go with them.
Popular Topics in Statistics
Probability
Single and combined events, with and without replacement, mutually exclusive and independent events, and tree diagrams.
Mean, Median & Mode
Averages from a list, from a frequency table and from grouped data, including the assumed-mean (coding) method.
Frequency Distributions
Building a grouped frequency table, class boundaries and midpoints, and cumulative frequency curves.
Charts & Graphs
Bar charts, pie charts, histograms with unequal widths, frequency polygons and what each one is appropriate for.
Spread
Range, quartiles and the interquartile range, variance and standard deviation, and comparing two data sets.
Correlation & Regression
Scatter diagrams, the line of best fit, the correlation coefficient and the difference between correlation and cause.
Sampling
Population and sample, random and stratified sampling, bias, and why a sample must be representative.
Distributions
The binomial and normal distributions, expected value, and reading probabilities from standardised scores.
How ScanSolve Helps with Statistics
Photograph a table or a tree diagram and ScanSolve sets out the calculation in the order examiners expect: the table completed first, then the totals, then the average or probability that the question asks for. For grouped data it shows the midpoints it is using, because that is the step most often skipped and most often wrong.
Probability answers state the sample space before they state a fraction, and say whether the events are independent or exclusive — the two words that decide whether you multiply or add. Where a question can be done by tree diagram or by formula, the solution shows the tree, since it is easier to check.
Study Tips for Statistics
Write the sample space out for small problems. "A die is rolled" has six outcomes; listing them once prevents nearly every probability slip.
Multiply for "and", add for mutually exclusive "or". Deciding which word the question used is the whole of the difficulty.
For grouped data, remember you are estimating: the midpoint stands in for every value in the class, so your mean is an estimate and should be described as one.
Check that probabilities total 1 and frequencies total the stated sample size. Both give you a free check on the arithmetic.
Get Statistics Help on WhatsApp
Send a photo of your statistics homework and get step-by-step solutions instantly. No app download needed.
Message Us on WhatsAppFrequently Asked Statistics Questions
How can ScanSolve help with Statistics homework?
ScanSolve's AI solves statistics problems step by step. Snap a photo of your homework or type your question to get instant, detailed solutions with clear explanations.
Is Statistics homework help free on ScanSolve?
Yes, ScanSolve offers free statistics homework help with step-by-step solutions. Upgrade to Pro at $89.99/year (about $7.50/month) or $9.99/week for unlimited answers and priority support.
What Statistics topics does ScanSolve cover?
ScanSolve covers all statistics topics including Probability, Mean, Median & Mode, Frequency Distributions, Charts & Graphs, Spread. Upload any statistics problem and get a step-by-step solution.
Can ScanSolve solve statistics problems from a photo?
Yes. Take a photo of your statistics homework and ScanSolve's AI will read the problem, identify the method needed, and provide a complete step-by-step solution.
How accurate are ScanSolve's statistics solutions?
ScanSolve uses advanced AI to deliver accurate, step-by-step statistics solutions. Each answer includes detailed explanations so you can verify the reasoning and learn the method.
Statistics Study Guides & Articles
How to Calculate Probability: Basic, Conditional & Bayes' Theorem
Learn how to calculate probability from basic concepts to conditional probability and Bayes' theorem. Clear examples and formulas for statistics and math students.
MathematicsFree Mathway Alternative — Unlimited AI Math Solver Without Subscription
Find the best free Mathway alternative with step-by-step solutions. ScanSolve gives you unlimited math solving with full explanations — no $9.99/mo subscription.
MathematicsStandard Deviation Formula: How to Calculate with Examples
Learn the standard deviation formula for both population and sample data. Step-by-step calculation guide with examples, variance, and when to use each formula.
More in Maths
Explore More Subjects
Have a Statistics question?
Get an instant AI-powered step-by-step solution in seconds.