
We read your photo as:
What are two uses of industrial tree plantations and one adaptation of pine trees to grow tall? Also, describe how to draw a bar graph for tree species data.
Biology
ScanSolve AI Answer
here are the answers to your questions:
2.6.1 Two uses of industrial tree plantations are:
- Pulp
- Paper
2.6.2 One adaptation of pine trees to grow to great heights is:
- They have strong, woody trunks that provide structural support, allowing them to grow tall and withstand environmental forces like wind.
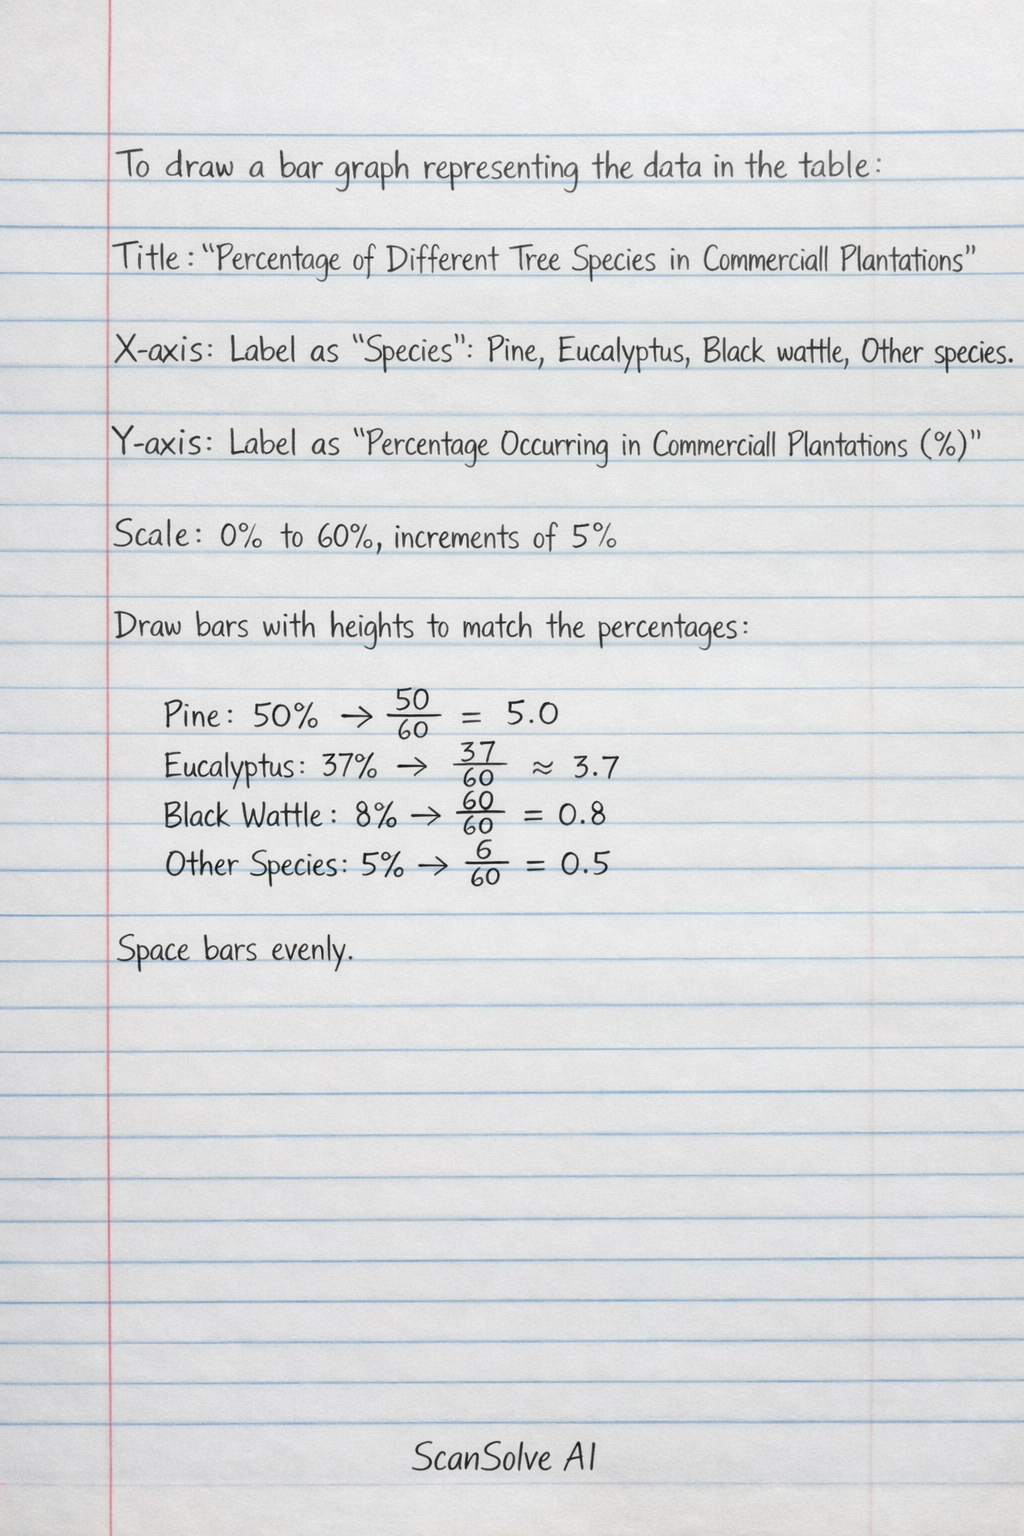
2.6.3 To draw a bar graph representing the data in the table:
- Title: "Percentage of Different Tree Species in Commercial Plantations"
- X-axis (horizontal): Label this axis "Species" and mark categories for Pine, Eucalyptus, Black wattle, and Other species.
- Y-axis (vertical): Label this axis "Percentage Occurring in Commercial Plantations (%)". Choose an appropriate scale, for example, from 0% to 60%, with increments of 5% or 10%.
- Bars: Draw rectangular bars of equal width for each species. The height of each bar should correspond to its percentage:
- Pine: 50%
- Eucalyptus: 37%
- Black wattle: 8%
- Other species: 5%
- Ensure there are equal spaces between the bars.
Was this helpful?
Still stuck on this one?
Ask a follow-up, and the answer starts from this question.
Got a different question?Ask your own question
More Biology Questions
QOutline four problems facing forestry in Kenya and explain how to draw a compound bar graph for crop…QExplain four problems facing forestry in Kenya and draw a compound bar graph for Wheat, Maize and…QUsing the years as the base of the graph and a scale of 2 cm to represent 10,000 tonnes of palm oil…QUsing the provided data, calculate cumulative production for each year and describe how to draw a…QIdentify the tree in the image and describe its uses.
Handwritten Step-by-Step Solution
Get this as a handwritten image on WhatsApp — like a tutor wrote it for you.
Try on WhatsApp