
We read your photo as:
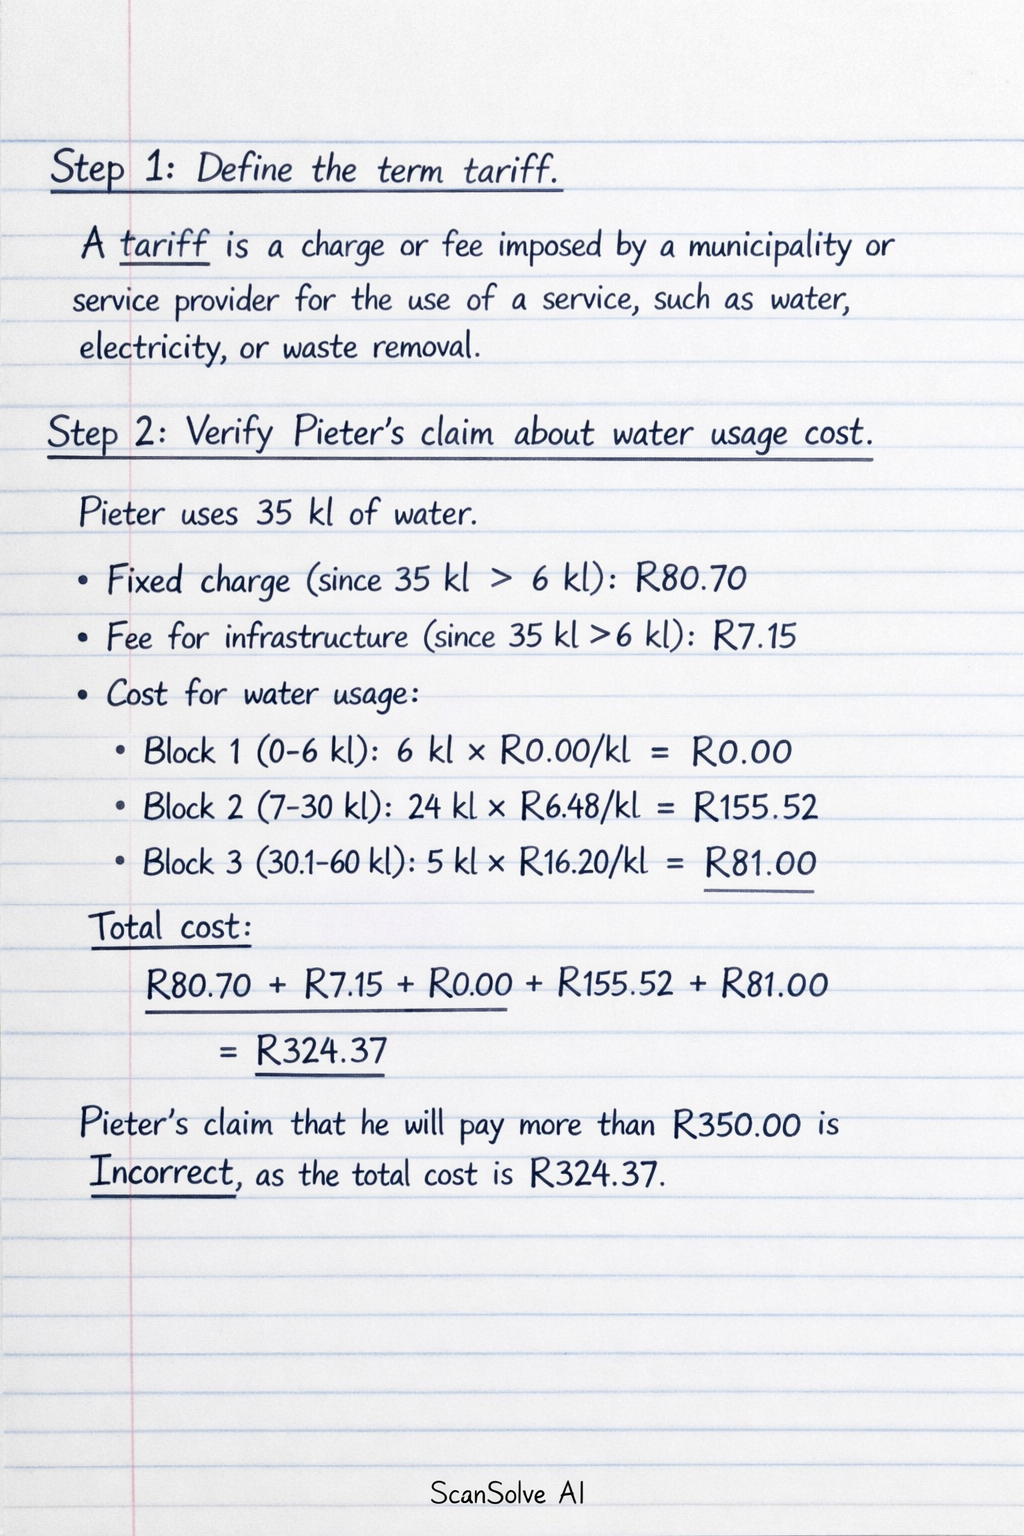
Define the term tariff.
ScanSolve AI Answer
Step-by-step solution
8 stepsDefine the term tariff.
A tariff is a charge or fee imposed by a municipality or service provider for the use of a service, such as water, electricity, or waste removal.
Verify Pieter's claim about water usage cost.
Pieter uses 35 kl of water.
- Fixed charge (since 35 kl > 6 kl): R80.70
- Fee for infrastructure (since 35 kl > 6 kl): R7.15
- Cost for water usage:
- Block 1 (0-6 kl):
- Block 2 (7-30 kl):
- Block 3 (30.1-60 kl):
- Total cost:
Pieter's claim that he will pay more than R350.00 is ❌ Incorrect, as the total cost is R324.37.
Calculate the VAT amount for block 3.
The rate for block 3 is R16.20, which is inclusive of 15% VAT.
Let the original price be . Then .The VAT amount is :
Rounded to two decimal places, the VAT amount is .
Give two explanations for why municipalities impose tariffs on customers.
- To cover the cost of providing essential services such as water, electricity, and waste management, including maintenance of infrastructure and operational expenses.
- To generate revenue that can be used for municipal development projects, improving public services, and funding other community needs.
Write down the formula for calculating the cost of baking bread.
From the problem statement, the cost of baking one loaf is R4.00, and from TABLE 3, the fixed cost (for 0 loaves) is R450.00.
Let be the total cost and be the number of loaves.The formula for calculating the cost of baking bread is .
Calculate the missing values A and B.
- Value A (Total cost for 300 loaves): Using the formula from Step 5:
- Value B (Total income for 180 loaves): From the problem statement, a loaf is sold at R6.50.
The missing values are and .
Calculate the cost of baking 50 loaves.
Using the formula from Step 5:
The cost of baking 50 loaves is .
Describe how to draw the graphs for income and cost.
To draw the graphs, you would set up a coordinate system:
- The x-axis (horizontal) represents the "Number of loaves" (from 0 to 300).
- The y-axis (vertical) represents "Cost/Income (in rands)" (from 0 to at least R2000).
For the Cost graph (using values from TABLE 3 and calculated A):
Plot the following points:
(0, R450), (60, R690), (120, R930), (180, R1170), (240, R1410), (300, R1650).
Draw a straight line connecting these points. This line represents the total cost.For the Income graph (using values from TABLE 4 and calculated B):
Plot the following points:
(0, R0), (60, R390), (120, R780), (180, R1170), (240, R1560), (300, R1950).
Draw a straight line connecting these points. This line represents the total income.The point where the two lines intersect is the break-even point, where total cost equals total income. In this case, it appears to be at 180 loaves and R1170.
Still stuck on this one?
Ask a follow-up, and the answer starts from this question.
More Economics Questions
Handwritten Step-by-Step Solution
Get this as a handwritten image on WhatsApp — like a tutor wrote it for you.
Try on WhatsApp