A student uses prepaid data bundles. The following prices are shown for 15GB, 200GB, and 400GB bundles. Determine the price (in cents) of 1 MB of data if the student buys 400 GB.

Mathematics
A student uses prepaid data bundles. The following prices are shown for 15GB, 200GB, and 400GB bundles. Determine the price (in cents) of 1 MB of data if the student buys 400 GB.

ScanSolve AI Answer

Answer

0.09975 cents/MB

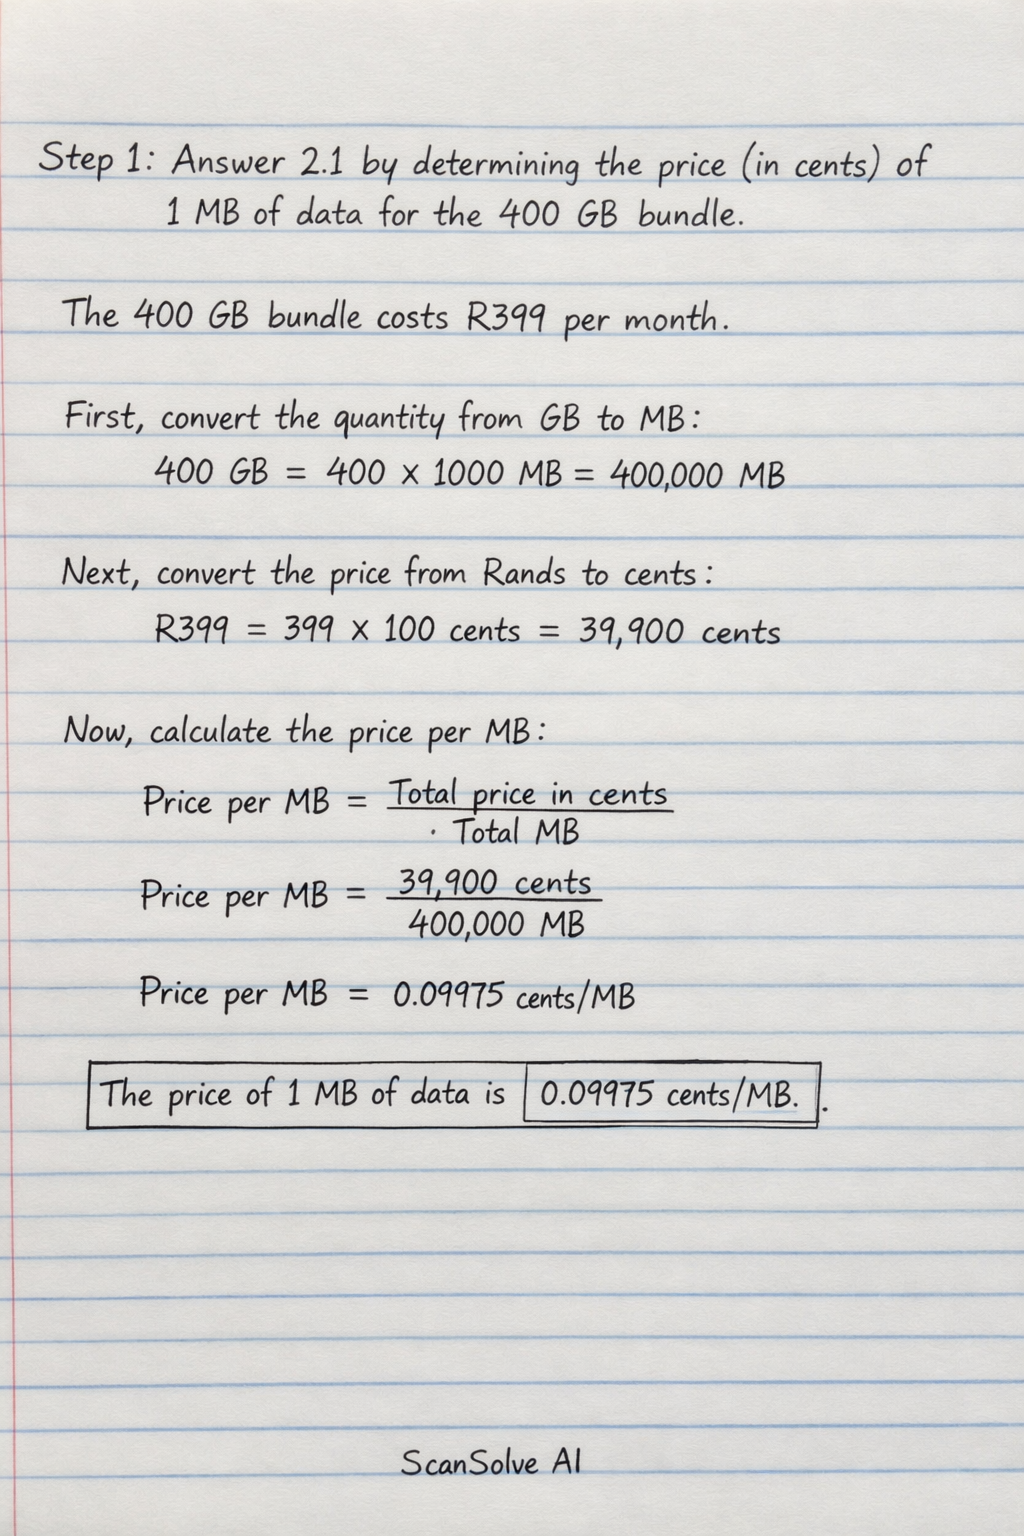
Step 1: Answer 2.1 by determining the price (in cents) of 1 MB of data for the 400 GB bundle. The 400 GB bundle costs R399 per month. First, convert the quantity from GB to MB: 400GB=400×1000MB=400000 MB400 GB = 400 \times 1000 MB = 400\,000 \text{ MB} Next, convert the price from Rands to cents: R399=399×100cents=39900 cents\text{R}399 = 399 \times 100 cents = 39\,900 \text{ cents} Now, calculate the price per MB: Price per MB=TotalpriceincentsTotalMB\text{Price per MB} = \frac{Total price in cents}{Total MB} Price per MB=39900cents400000MB\text{Price per MB} = \frac{39\,900 cents}{400\,000 MB} Price per MB=0.09975 cents/MB\text{Price per MB} = 0.09975 \text{ cents/MB} The price of 1 MB of data is 0.09975cents/MB\boxed{0.09975 cents/MB}.

Step 2: Answer 2.2 by describing how to draw a graph of data versus price per month. To draw the graph, plot the following points on a coordinate plane: • (15 GB, R129) • (200 GB, R299) • (400 GB, R399) The x-axis should be labelled "Data (GB)" and the y-axis should be labelled "Price per month (R)". Choose appropriate scales for both axes to accommodate the given values. For example, the x-axis could go from 0 to 450 GB, and the y-axis from 0 to R450. Connect the plotted points with a smooth curve or line segment. The graph will show that as the data bundle size increases, the price per month also increases, but not proportionally, indicating a decreasing cost per GB for larger bundles.

Step 3: Answer 2.3 by estimating the cost of 100 GB of data using the described graph. Based on the data points: • 15 GB costs R129 • 200 GB costs R299 To estimate the cost of 100 GB, locate 100 GB on the x-axis. Draw a vertical line from 100 GB up to the curve connecting the points (15, 129) and (200, 299). Then, draw a horizontal line from that intersection point to the y-axis to read the estimated price. Using linear interpolation between (15, 129) and (200, 299): The slope m=29912920015=1701850.9189m = \frac{299 - 129}{200 - 15} = \frac{170}{185} \approx 0.9189. The equation of the line is P129=0.9189(D15)P - 129 = 0.9189(D - 15). For D=100D = 100: P=129+0.9189(10015)P = 129 + 0.9189(100 - 15) P=129+0.9189(85)P = 129 + 0.9189(85) P=129+78.1065P = 129 + 78.1065 P207.11P \approx 207.11 Given that the price per GB decreases for larger bundles, the actual curve would be slightly below a straight line connecting the points. A reasonable estimate from the graph would be around R200 to R220. The estimated cost of 100 GB of data is approximately R207\boxed{R207}.

Step 4: Answer 2.4 by explaining why buying larger bundles is often cheaper per MB. Buying larger data bundles is often cheaper per MB due to economies of scale. Service providers incur certain fixed costs (e.g., network infrastructure, administrative overhead, marketing) regardless of the bundle size. By selling larger bundles, these fixed costs are spread over a greater quantity of data, reducing the cost per unit (MB). Additionally, offering lower per-MB prices for larger bundles is a marketing strategy to encourage customers to purchase more data and commit to higher spending, which benefits the provider.

Was this helpful?

Need help with your own homework?

Get instant step-by-step solutions to any question. Free to start.

Ask Your Question
Handwritten step-by-step solution preview

Handwritten Step-by-Step Solution

Get this as a handwritten image on WhatsApp — like a tutor wrote it for you.

Try on WhatsApp

Still have questions?

Quick Answer

Answer 2.1 by determining the price (in cents) of 1 MB of data for the 400 GB bundle.

A student uses prepaid data bundles. The following prices are shown for 15GB, 200GB, and 400GB bundles. Determine the price (in cents) of 1 MB of data if the student buys 400 GB.
Mathematics

This mathematics problem involves applying core mathematical principles and formulas. Below you will find a complete step-by-step solution with detailed explanations for each step, helping you understand not just the answer but the method behind it.

ScanSolve AI Answer
Step 1: Answer 2.1 by determining the price (in cents) of 1 MB of data for the 400 GB bundle. The 400 GB bundle costs R399 per month. First, convert the quantity from GB to MB: 400 GB = 400 × 1000 MB = 400\,000 MB Next, convert the price from Rands to cents: R399 = 399 × 100 cents = 39\,900 cents Now, calculate the price per MB: Price per MB = Total price in centsTotal MB Price per MB = 39\,900 cents400\,000 MB Price per MB = 0.09975 cents/MB The price of 1 MB of data is 0.09975 cents/MB. Step 2: Answer 2.2 by describing how to draw a graph of data versus price per month. To draw the graph, plot the following points on a coordinate plane: • (15 GB, R129) • (200 GB, R299) • (400 GB, R399) The x-axis should be labelled "Data (GB)" and the y-axis should be labelled "Price per month (R)". Choose appropriate scales for both axes to accommodate the given values. For example, the x-axis could go from 0 to 450 GB, and the y-axis from 0 to R450. Connect the plotted points with a smooth curve or line segment. The graph will show that as the data bundle size increases, the price per month also increases, but not proportionally, indicating a decreasing cost per GB for larger bundles. Step 3: Answer 2.3 by estimating the cost of 100 GB of data using the described graph. Based on the data points: • 15 GB costs R129 • 200 GB costs R299 To estimate the cost of 100 GB, locate 100 GB on the x-axis. Draw a vertical line from 100 GB up to the curve connecting the points (15, 129) and (200, 299). Then, draw a horizontal line from that intersection point to the y-axis to read the estimated price. Using linear interpolation between (15, 129) and (200, 299): The slope m = (299 - 129)/(200 - 15) = (170)/(185) ≈ 0.9189. The equation of the line is P - 129 = 0.9189(D - 15). For D = 100: P = 129 + 0.9189(100 - 15) P = 129 + 0.9189(85) P = 129 + 78.1065 P ≈ 207.11 Given that the price per GB decreases for larger bundles, the actual curve would be slightly below a straight line connecting the points. A reasonable estimate from the graph would be around R200 to R220. The estimated cost of 100 GB of data is approximately R207. Step 4: Answer 2.4 by explaining why buying larger bundles is often cheaper per MB. Buying larger data bundles is often cheaper per MB due to economies of scale. Service providers incur certain fixed costs (e.g., network infrastructure, administrative overhead, marketing) regardless of the bundle size. By selling larger bundles, these fixed costs are spread over a greater quantity of data, reducing the cost per unit (MB). Additionally, offering lower per-MB prices for larger bundles is a marketing strategy to encourage customers to purchase more data and commit to higher spending, which benefits the provider.