
We read your photo as:
Plot the graphs
English
ScanSolve AI Answer
Step-by-step solution
4 stepslet's plot those graphs for 3.1.2, thanyani.
Identify key features for
The equation is in the form .
- The y-intercept () is . This means the line crosses the y-axis at the point .
- The gradient () is 2. This means for every 1 unit increase in , the value increases by 2 units.
Plot the graph for
- Start by plotting the y-intercept: .
- From this point, use the gradient: move 1 unit to the right (positive x-direction) and 2 units up (positive y-direction). This brings you to the point .
- Draw a straight line connecting the points and . You can extend this line in both directions.
Identify key features for
The equation is in the form .
- The y-intercept () is 1. This means the line crosses the y-axis at the point .
- The gradient () is . This means for every 1 unit increase in , the value decreases by 2 units.
Plot the graph for
- Start by plotting the y-intercept: .
- From this point, use the gradient: move 1 unit to the right (positive x-direction) and 2 units down (negative y-direction). This brings you to the point .
- Draw a straight line connecting the points and . You can extend this line in both directions.
Was this helpful?
Still stuck on this one?
Ask a follow-up, and the answer starts from this question.
Got a different question?Ask your own question
More English Questions
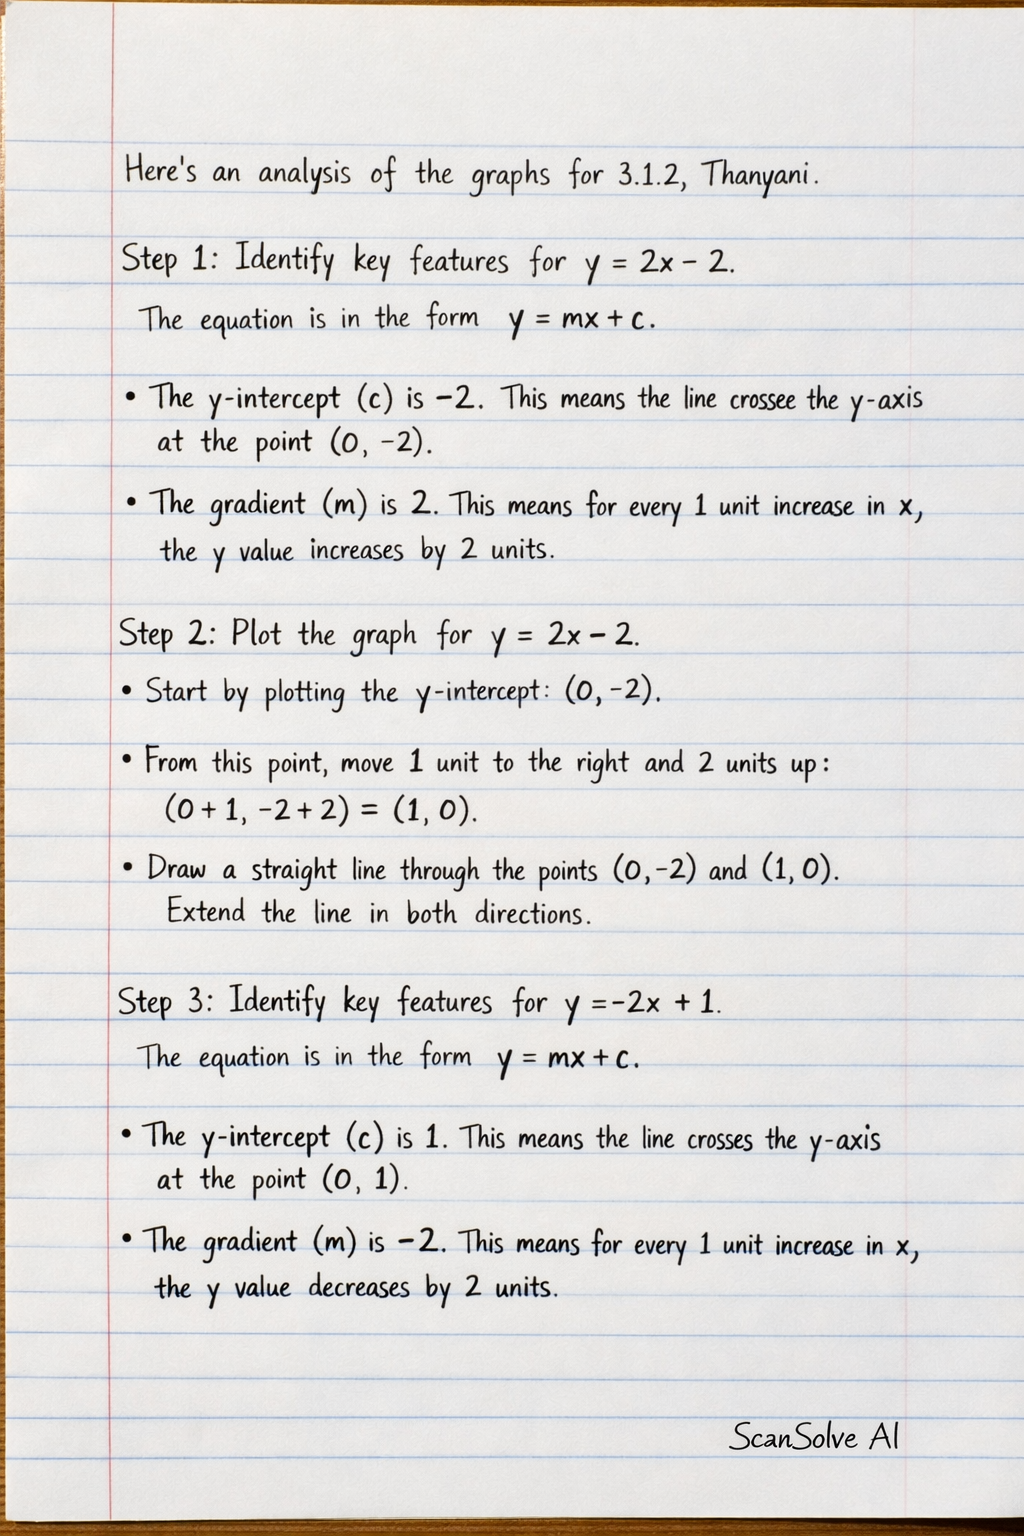
Handwritten Step-by-Step Solution
Get this as a handwritten image on WhatsApp — like a tutor wrote it for you.
Try on WhatsApp