
We read your photo as:
On the grid provided, represent the linear inequalities 2y+x >= 0, x <= 3 and 3x-5y > -15.
ScanSolve AI Answer
Answer
To represent the linear inequalities on the grid, we will draw the boundary lines for each inequality and then identify the region that satisfies all of them. The feasible region will be left unshaded, while the unwanted regions will be shaded.
Step-by-step solution
3 stepsDraw the line for the inequality .
First, consider the equation , which can be rewritten as .
- This is a solid line because the inequality includes "equal to" ().
- Plot points: If . If . If .
- To determine the region, test a point not on the line, e.g., : . Since is true, the region containing is the feasible region. Therefore, shade the region below the line .
Draw the line for the inequality .
First, consider the equation .
- This is a solid vertical line passing through because the inequality includes "equal to" ().
- Plot points: , , , etc.
- To determine the region, test a point not on the line, e.g., : is true. So, the region containing is the feasible region. Therefore, shade the region to the right of the line .
Draw the line for the inequality .
First, consider the equation .
- This is a dashed line because the inequality does not include "equal to" ().
- Plot points: If . Point: . If . Point: .
- To determine the region, test a point not on the line, e.g., : . Since is true, the region containing is the feasible region. Therefore, shade the region above the line .
The feasible region is the unshaded area on the grid, bounded by these three lines. It is the region that is:
- Above or on the line .
- To the left of or on the line .
- Below the line .
3 zimekamilika, zimebaki 2 leo. Unapiga hatua.
Still stuck on this one?
Ask a follow-up, and the answer starts from this question.
More Mathematics Questions
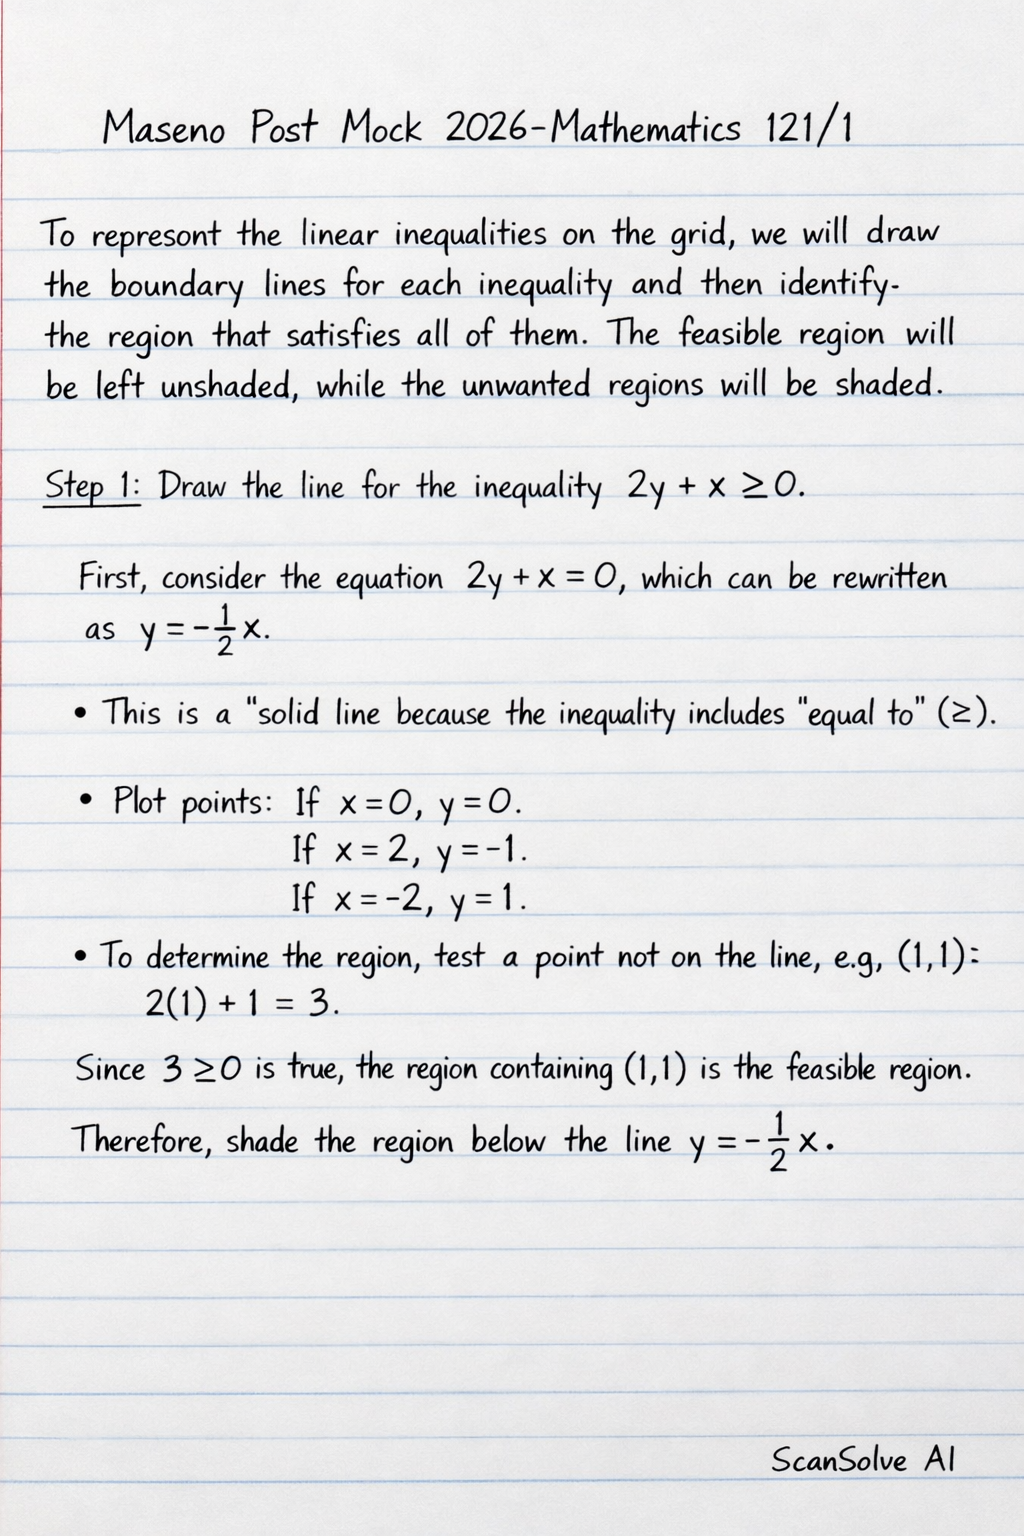
Handwritten Step-by-Step Solution
Get this as a handwritten image on WhatsApp — like a tutor wrote it for you.
Try on WhatsApp