
We read your photo as:
On the same set of axes, project this information comparing the tariffs of these providers. Label your graph adequately.
ScanSolve AI Answer
Step-by-step solution
7 stepsQuestion 1
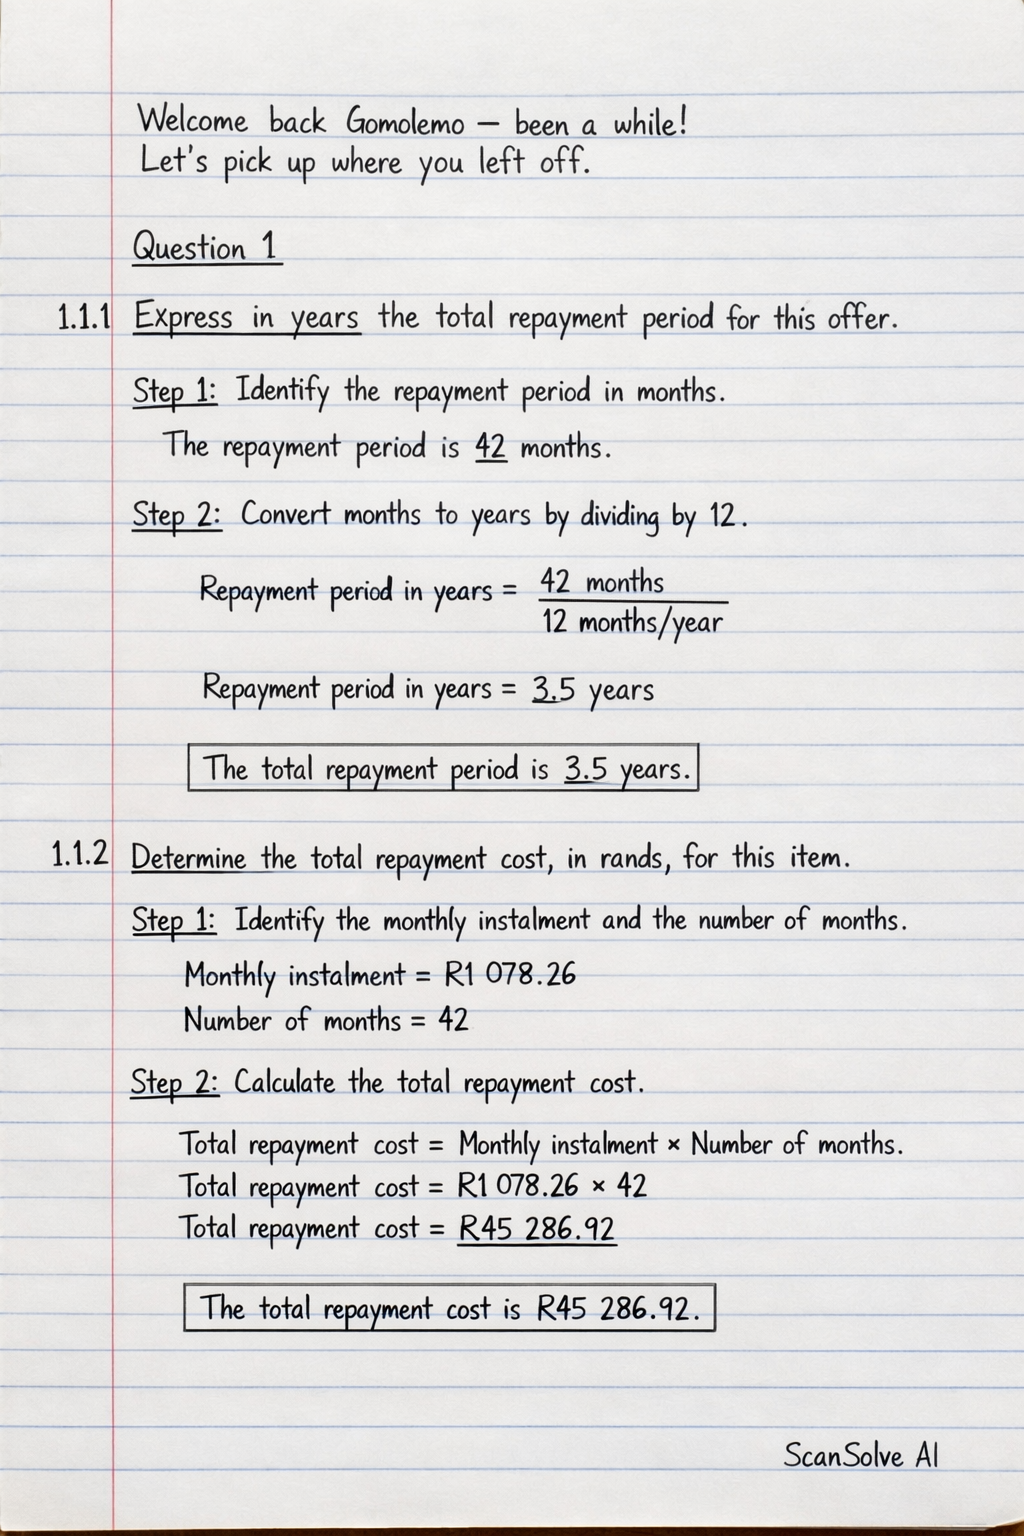
1.1.1 Express in years the total repayment period for this offer.
Identify the repayment period in months.
The repayment period is 42 months.
Convert months to years by dividing by 12.
The total repayment period is .
1.1.2 Determine the total repayment cost, in rands, for this item.
Identify the monthly instalment and the number of months.
Monthly instalment = R1 078.26
Number of months = 42Calculate the total repayment cost.
The total repayment cost is .
1.1.3 The advertised price for this item is R29 999.00. Furn-Furnitures offers a 17% discount for once-off cash payments. Calculate the amount the buyer will finally pay.
Identify the advertised price and the discount percentage.
Advertised price = R29 999.00
Discount = 17%Calculate the discount amount.
Calculate the final amount the buyer will pay after the discount.
The buyer will finally pay .
1.2 On the same set of axes, project this information comparing the tariffs of these providers. Label your graph adequately.
To compare the tariffs, you will plot the cost of a call (in Rands) against the duration of the call (in minutes).Let be the duration of the call in minutes and be the cost of the call in Rands.
-
Off-net calls:
- FreeCom Off-net: Charges R1.20 per minute.
- Talkcom Off-net: Charges 79 cents (R0.79) per minute.
-
On-net calls (for both networks): On-net calls are billed for the first 3 minutes, with a cap of R3.60 for calls shorter than 60 minutes. This means the rate for the first 3 minutes is R1.20 per minute (R3.60 / 3 minutes), and then the cost remains R3.60 for calls longer than 3 minutes but shorter than 60 minutes.
- On-net (Both FreeCom and Talkcom):
Graphing Instructions:
- Draw a set of axes. Label the horizontal axis "Call Duration (minutes)" and the vertical axis "Cost (Rands)".
- Plot the line for FreeCom Off-net: This is a straight line starting from (0,0) with a gradient of 1.20. For example, at minutes, .
- Plot the line for Talkcom Off-net: This is a straight line starting from (0,0) with a gradient of 0.79. This line will be less steep than FreeCom's off-net line. For example, at minutes, .
- Plot the tariff for On-net calls:
- For minutes, draw a straight line from (0,0) with a gradient of 1.20, reaching the point (3, R3.60).
- For minutes, draw a horizontal line from (3, R3.60) to (60, R3.60).
- Label each line clearly on the graph (e.g., "FreeCom Off-net", "Talkcom Off-net", "On-net Calls").
-
Still stuck on this one?
Ask a follow-up, and the answer starts from this question.
More Mathematics Questions
Handwritten Step-by-Step Solution
Get this as a handwritten image on WhatsApp — like a tutor wrote it for you.
Try on WhatsApp