
We read your photo as:
Plot the information from the above table on the Cartesian Plane with a ruler to form a straight line graph.
Mathematics
ScanSolve AI Answer
Step-by-step solution
3 stepsHere's how to plot the information from the table:
2.3.1)
Identify the coordinate pairs from the table.
The table provides the following coordinate pairs:
Plot each point on the Cartesian Plane.
- For , move 1 unit left on the x-axis and 8 units up on the y-axis.
- For , stay at the origin on the x-axis and move 6 units up on the y-axis.
- For , move 1 unit right on the x-axis and 4 units up on the y-axis.
- For , move 2 units right on the x-axis and 2 units up on the y-axis.
- For , move 3 units right on the x-axis and stay on the x-axis.
Draw a straight line.
Using a ruler, connect all the plotted points. You will see that they form a straight line.
Was this helpful?
Still stuck on this one?
Ask a follow-up, and the answer starts from this question.
Got a different question?Ask your own question
More Mathematics Questions
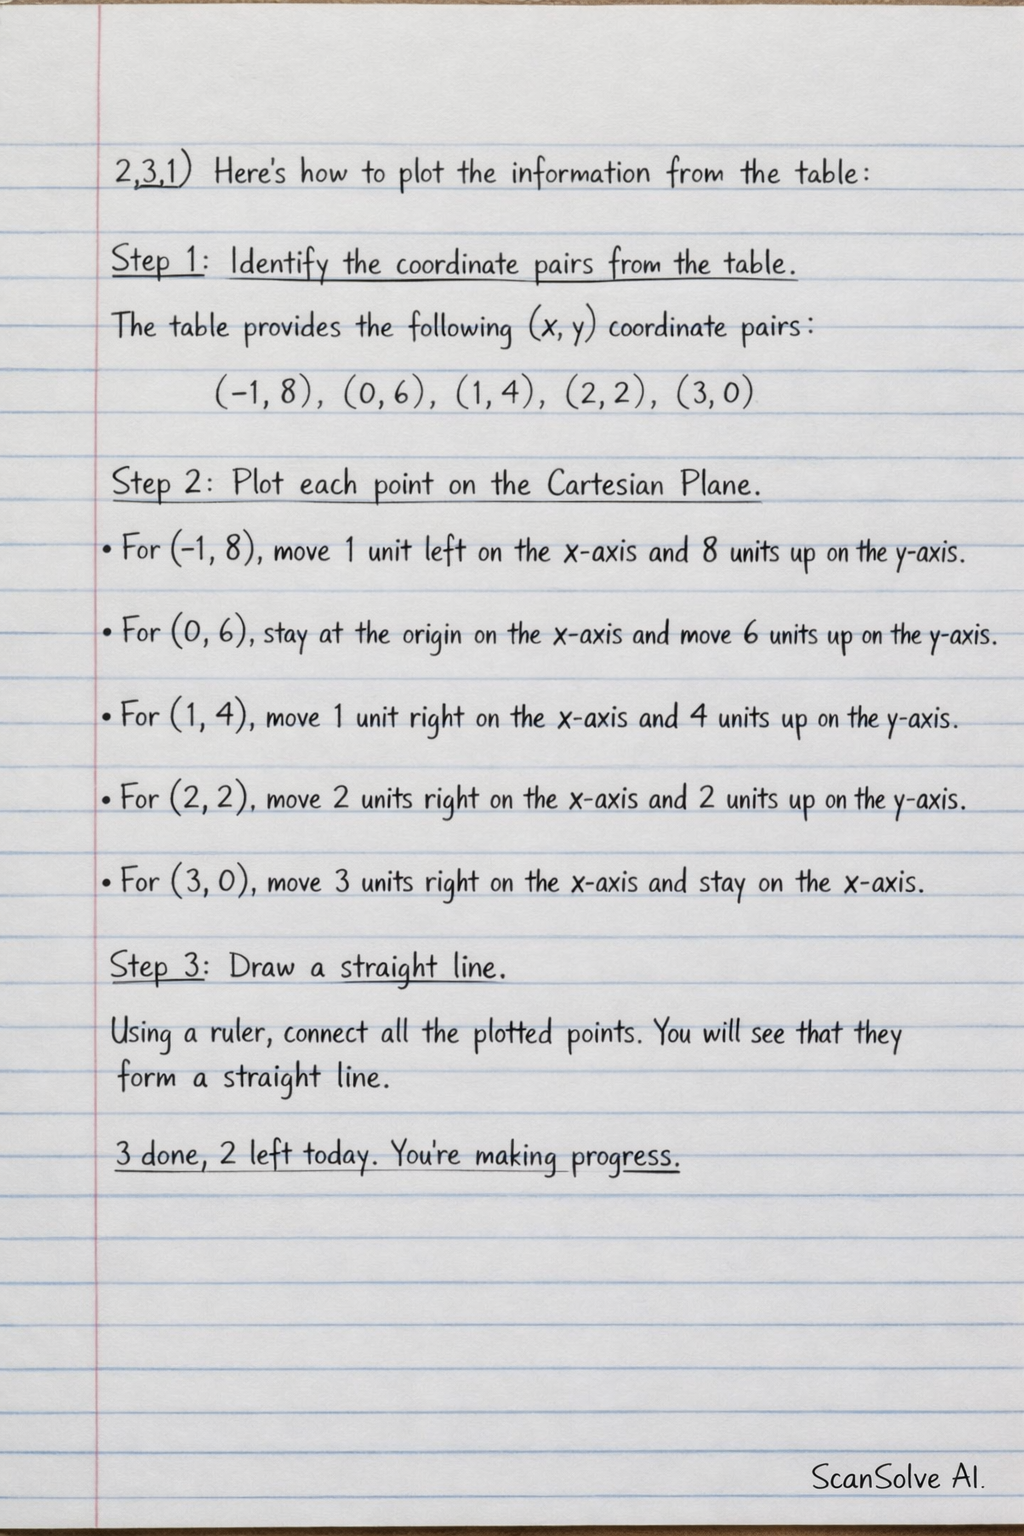
Handwritten Step-by-Step Solution
Get this as a handwritten image on WhatsApp — like a tutor wrote it for you.
Try on WhatsApp