
We read your photo as:
A car's motion is represented by a distance-time graph. Describe the motion in segments OA, AB, and BC, and calculate the average speed for the first 10 seconds.
Physics
ScanSolve AI Answer
Answer
Step-by-step solution
3 stepsPart a(i)
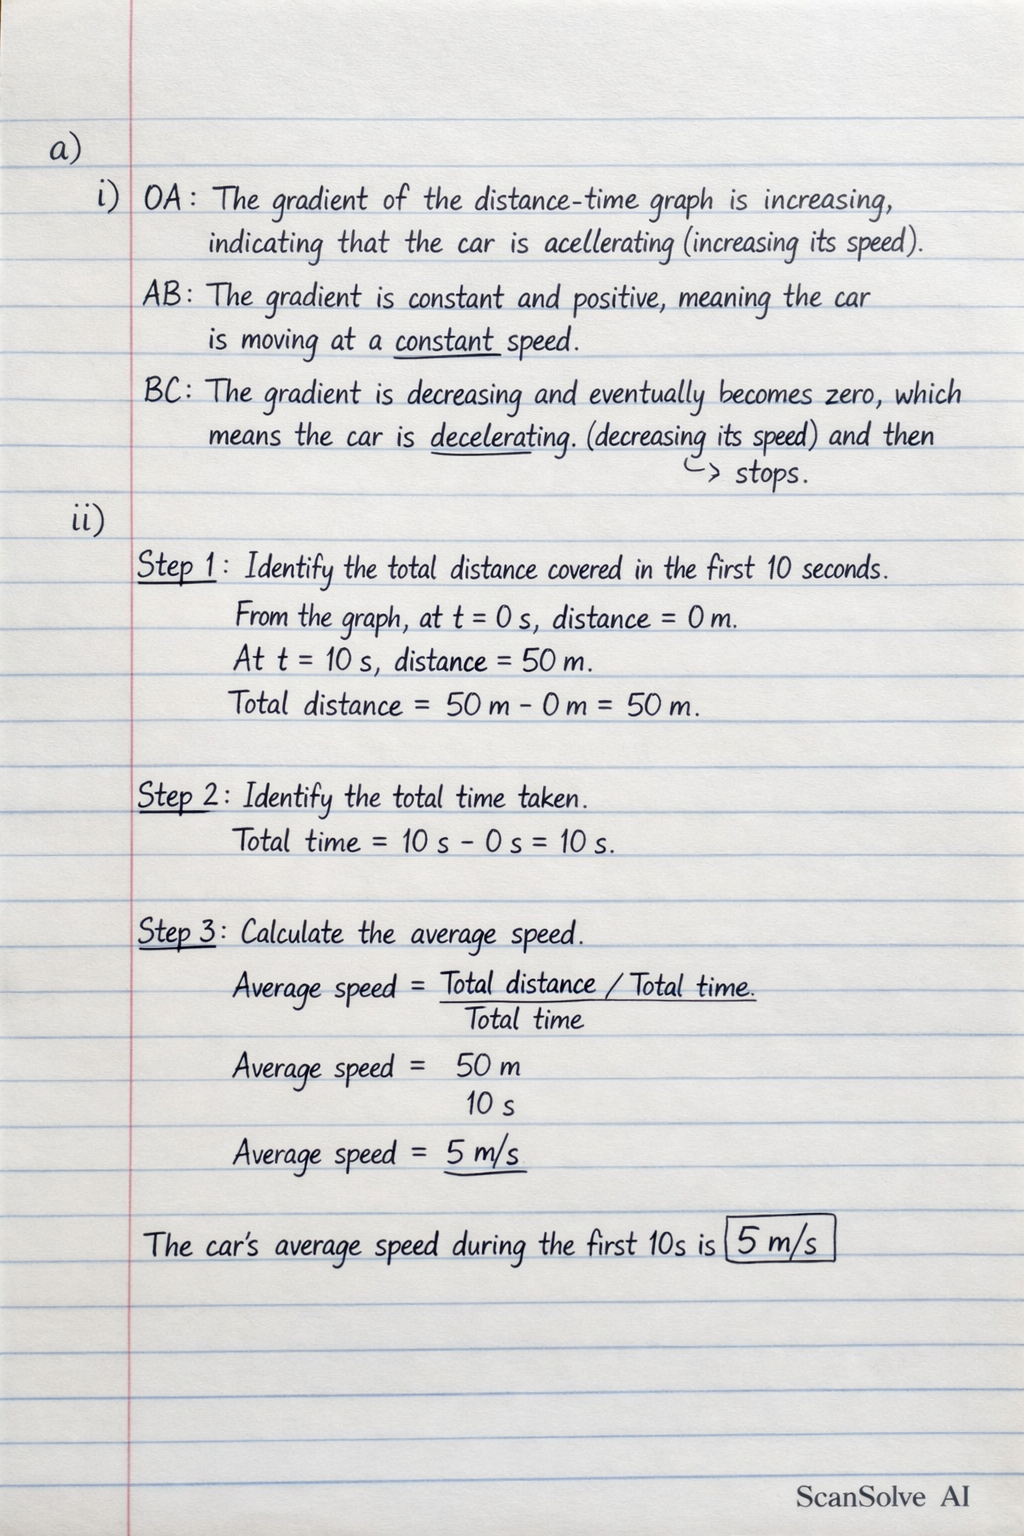
- OA: The gradient of the distance-time graph is increasing, indicating that the car is accelerating (increasing its speed).
- AB: The gradient is constant and positive, meaning the car is moving at a constant speed.
- BC: The gradient is decreasing and eventually becomes zero, which means the car is decelerating (decreasing its speed) and then stops.
Part a(ii)
Identify the total distance covered in the first 10 seconds.
From the graph, at , distance .
At , distance .
Total distance .Identify the total time taken.
Total time .
Calculate the average speed.
Average speed
The car's average speed during the first 10s is .
Was this helpful?
Try one yourself
A new problem that tests the same skill.
Still stuck on this one?
Ask a follow-up, and the answer starts from this question.
Got a different question?Ask your own question
More Physics Questions
QA car's motion is represented by a speed-time graph. Analyze the motion at points R, S, and T, find…QA car's speed is graphed over 12 seconds. It travels 40m in the first 4 seconds. Find max speed and…QA velocity-time graph for a car shows acceleration for the first 2s, constant velocity for the next…QA car is moving along a straight line. The displacement-time graph of the car is given below…QDescribe the motion of the bus using a speed-time graph and calculate its average speed.
Browse by topic:Mechanics
Handwritten Step-by-Step Solution
Get this as a handwritten image on WhatsApp — like a tutor wrote it for you.
Try on WhatsApp