
We read your photo as:
A student investigates how covering the surface of the water in a beaker affects the rate at which the water cools. Plan an experiment to investigate the relationship between covering the surface of water in a beaker and the rate at which the water cools.
ScanSolve AI Answer
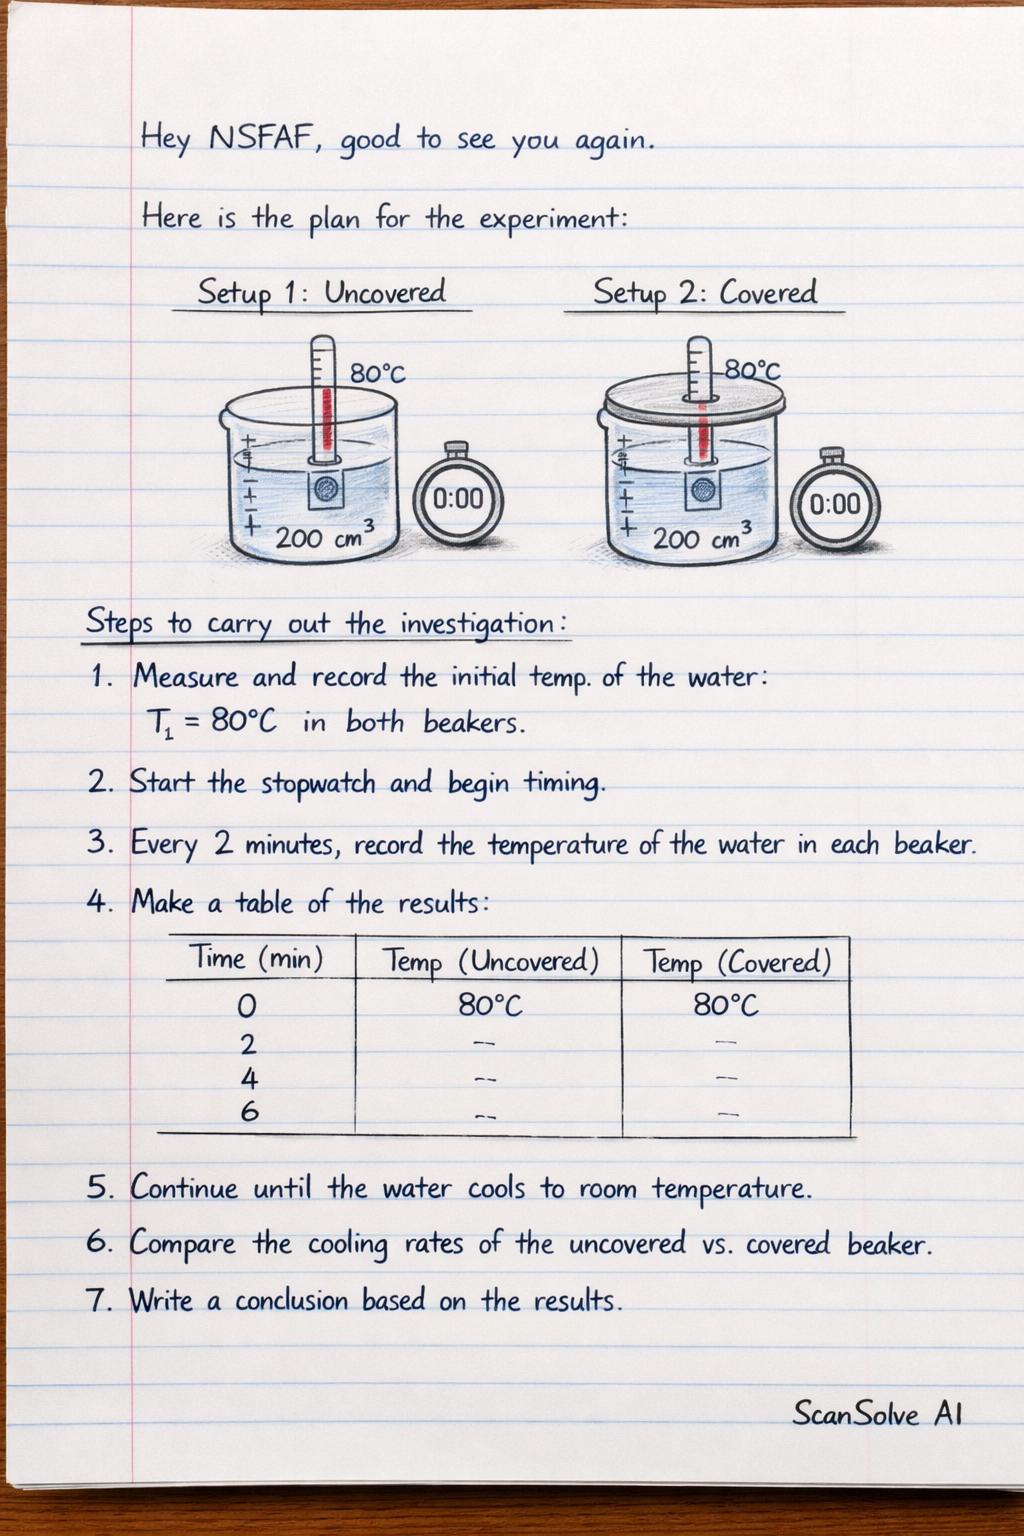
Here is the plan for the experiment:
Diagram:
As an AI, I cannot draw a diagram directly. However, the diagram should show two identical setups side-by-side:
- Setup 1 (Uncovered): A beaker containing hot water. A thermometer is immersed in the water, held by a clamp stand (not explicitly listed but implied for stability) or simply shown upright in the water. A stopwatch is shown nearby.
- Setup 2 (Covered): An identical beaker containing the same volume of hot water. A thermometer is immersed in the water. The circular lid is placed on top of this beaker, covering the water surface. A stopwatch is shown nearby.
Both setups should indicate the initial temperature of the water.
Explanation of how to carry out the investigation:
- Step 1: Use the electric kettle to boil water.
- Step 2: Pour an equal volume (e.g., ) of hot water into each of the two beakers.
- Step 3: Place a thermometer into each beaker. Wait a short moment for the temperature to stabilize and ensure both beakers start at the same initial temperature (e.g., ).
- Step 4: Place the circular lid on one of the beakers, ensuring it covers the water surface. Leave the other beaker uncovered.
- Step 5: Start the stopwatch simultaneously for both setups.
- Step 6: Record the temperature of the water in both the covered and uncovered beakers at regular time intervals (e.g., every ) for a total duration of minutes.
State measurement you would take:
- The initial temperature of the water in both beakers.
- The temperature of the water in both beakers at regular time intervals.
Draw a table with column headings to show how you would display your readings:
| Time / s | Temperature (Uncovered Beaker) / | Temperature (Covered Beaker) / |
|---|---|---|
| 0 | ||
| 60 | ||
| 120 | ||
| 180 | ||
| ... |
Explain how you would process your results:
- Step 1: Plot a graph of temperature (on the y-axis) against time (on the x-axis) for both the covered and uncovered beakers on the same set of axes.
- Step 2: Draw a smooth curve through the plotted points for each set of data.
- Step 3: Calculate the rate of cooling for each beaker by determining the gradient of the temperature-time graph at various points, or by comparing the total temperature drop over the entire duration.
Explain how you would use your results to reach a conclusion:
- By comparing the two cooling curves on the graph, the beaker with the steeper curve indicates a faster rate of cooling.
- If the curve for the uncovered beaker is steeper than that for the covered beaker, it means the uncovered water cooled faster.
- The conclusion would state whether covering the surface of the water increases or decreases the rate at which the water cools, based on which curve shows a slower temperature decrease over time.
State one key variable that you would control to ensure a fair test:
- The initial volume of water in both beakers.
- The initial temperature of the water in both beakers.
- The ambient room temperature.
- The material and size of the beakers.
Still stuck on this one?
Ask a follow-up, and the answer starts from this question.
More Physics Questions
Handwritten Step-by-Step Solution
Get this as a handwritten image on WhatsApp — like a tutor wrote it for you.
Try on WhatsApp