
We read your photo as:
A woman starts from her home at 9.00 am, walks with a speed of 5 Km h-1 on a straight road up to her office 2.5 Km away, stays at the office up to 5.00 pm, and returns home by an auto with a speed of 25 Km h-1. Choose suitable scales and plot the x-t graph of her motion.
Physics
ScanSolve AI Answer
Step-by-step solution
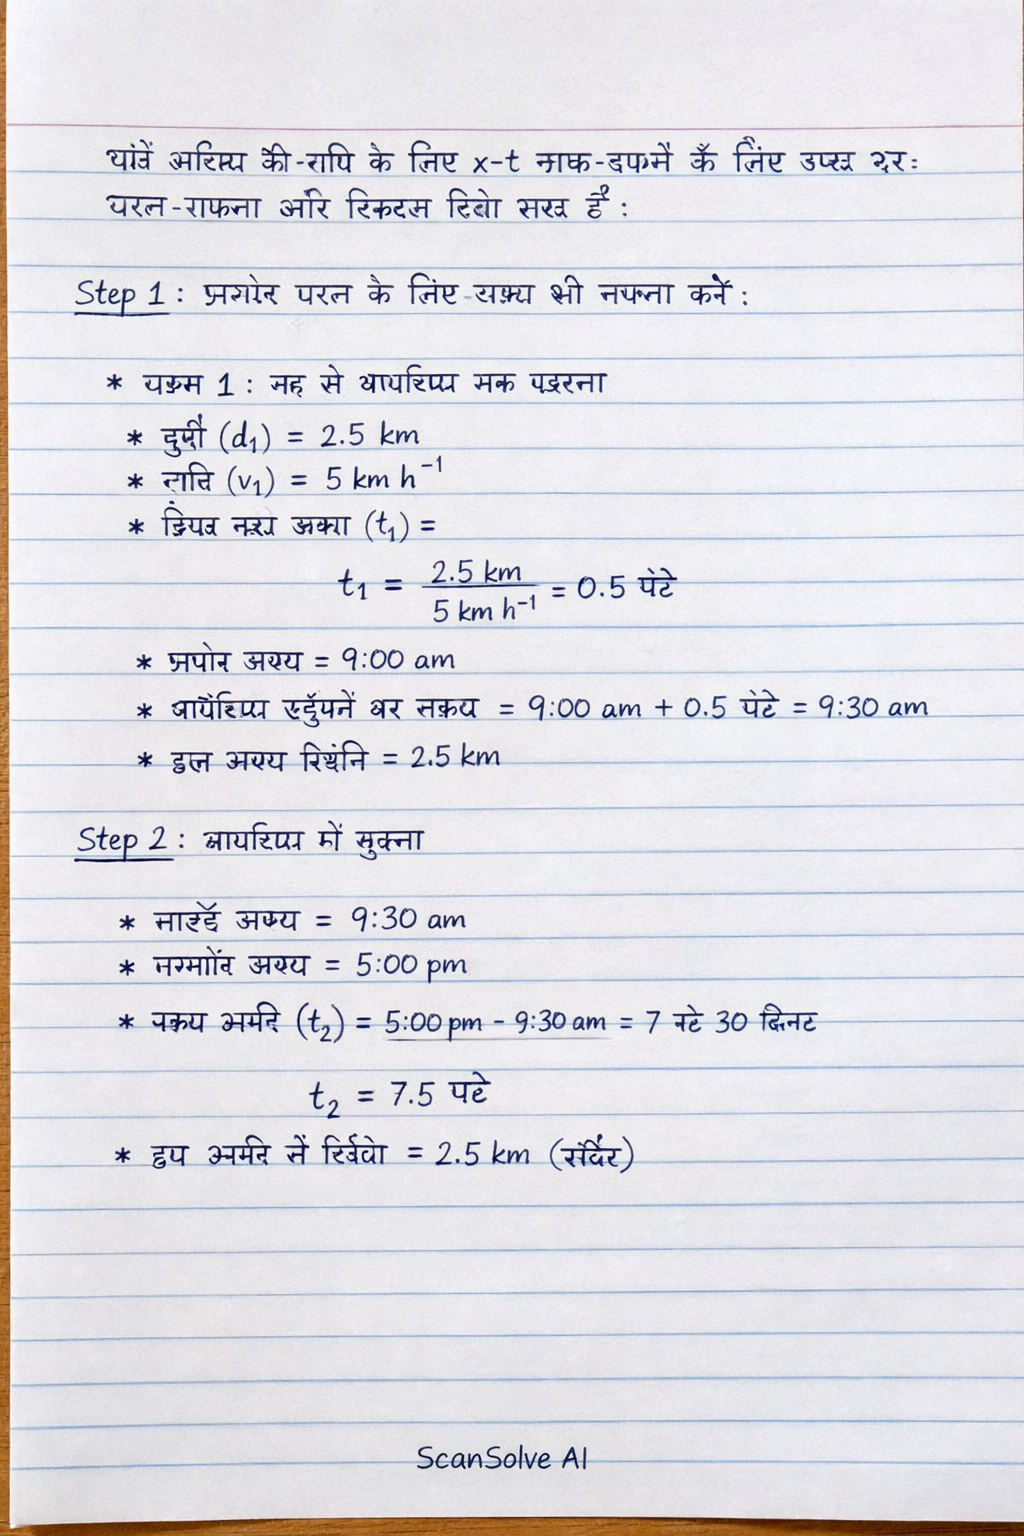
3 stepsयहाँ महिला की गति के लिए x-t ग्राफ बनाने के लिए चरण-दर-चरण गणना और विवरण दिया गया है:
प्रत्येक चरण के लिए समय की गणना करें।
-
चरण 1: घर से कार्यालय तक चलना
- दूरी () =
- गति () =
- लिया गया समय () =
- प्रारंभ समय = 9:00 am
- कार्यालय पहुंचने का समय = 9:00 am + 0.5 घंटे = 9:30 am
- इस समय स्थिति =
-
चरण 2: कार्यालय में रुकना
- प्रारंभ समय = 9:30 am
- समाप्ति समय = 5:00 pm
- समय अवधि () = 5:00 pm - 9:30 am = 7 घंटे 30 मिनट
- इस अवधि में स्थिति = (स्थिर)
-
चरण 3: ऑटो से घर लौटना
- दूरी () =
- गति () =
- लिया गया समय () =
- प्रारंभ समय = 5:00 pm
- घर पहुंचने का समय = 5:00 pm + 0.1 घंटे = 5:06 pm
- इस समय स्थिति =
-
x-t ग्राफ के लिए मुख्य बिंदु निर्धारित करें।
मान लीजिए 9:00 am पर है।
- बिंदु A (प्रारंभ):
- बिंदु B (कार्यालय पहुंचना):
- बिंदु C (कार्यालय से प्रस्थान): कुल समय =
- बिंदु D (घर पहुंचना): कुल समय =
x-t ग्राफ के लिए उपयुक्त पैमाने चुनें और ग्राफ का वर्णन करें।
-
उपयुक्त पैमाने:
- x-अक्ष (समय):
- y-अक्ष (स्थिति):
-
ग्राफ का विवरण:
- 9:00 am से 9:30 am तक (घर से कार्यालय): ग्राफ मूल बिंदु से तक एक सीधी रेखा होगी। इस खंड की ढलान धनात्मक होगी, जो की गति को दर्शाती है।
- 9:30 am से 5:00 pm तक (कार्यालय में रुकना): ग्राफ से तक एक क्षैतिज सीधी रेखा होगी। इस खंड की ढलान शून्य होगी, जो दर्शाता है कि महिला कार्यालय में स्थिर है।
- 5:00 pm से 5:06 pm तक (कार्यालय से घर): ग्राफ से तक एक सीधी रेखा होगी। इस खंड की ढलान ऋणात्मक होगी, जो घर की ओर वापसी को दर्शाती है। ढलान का परिमाण पहले खंड की ढलान से अधिक होगा, क्योंकि वापसी की गति है, जो चलने की गति से अधिक है।
यह ग्राफ महिला की गति को समय के साथ उसकी स्थिति में परिवर्तन के रूप में दर्शाता है।
-
Was this helpful?
Still stuck on this one?
Ask a follow-up, and the answer starts from this question.
Got a different question?Ask your own question
More Physics Questions
QThe graph shows a commuter's journey to work. His journey consists of two stages of travelling…QKaari travelled 24 kilometres and arrived at her destination at 10:00 a.m. having left at 8:00 a.m…QAmbrose drives at 50 km/h for 2 hours, rests for 1 hour, and then drives another 70 km in 1.5 hours…QUsing the provided graph and equation, answer the following questions about a cyclist's journey…QOn a certain day Mabel rode her bicycle for 45 minutes and then walked for 1 hours covering a total…
Browse by topic:Mechanics
Handwritten Step-by-Step Solution
Get this as a handwritten image on WhatsApp — like a tutor wrote it for you.
Try on WhatsApp