
We read your photo as:
How to determine the acceleration due to gravity (g) using a simple pendulum experiment and record measurements for d and h?
Physics
ScanSolve AI Answer
Step-by-step solution
6 stepsHere's a detailed guide to carrying out the experiment, following the instructions provided:
Setup and Initial Measurements
- i) Fix the drawing paper vertically on the drawing board using two clamps.
- ii) Suspend the pendulum bob so it hangs freely in front of the drawing paper.
- iii) Draw a line RP representing the rest position of the pendulum string. Mark point P at the center of the pendulum bob at rest.
- iv) Displace the pendulum bob to one side in a plane parallel to the drawing board.
- v) Mark the new position P' of the center of the bob.
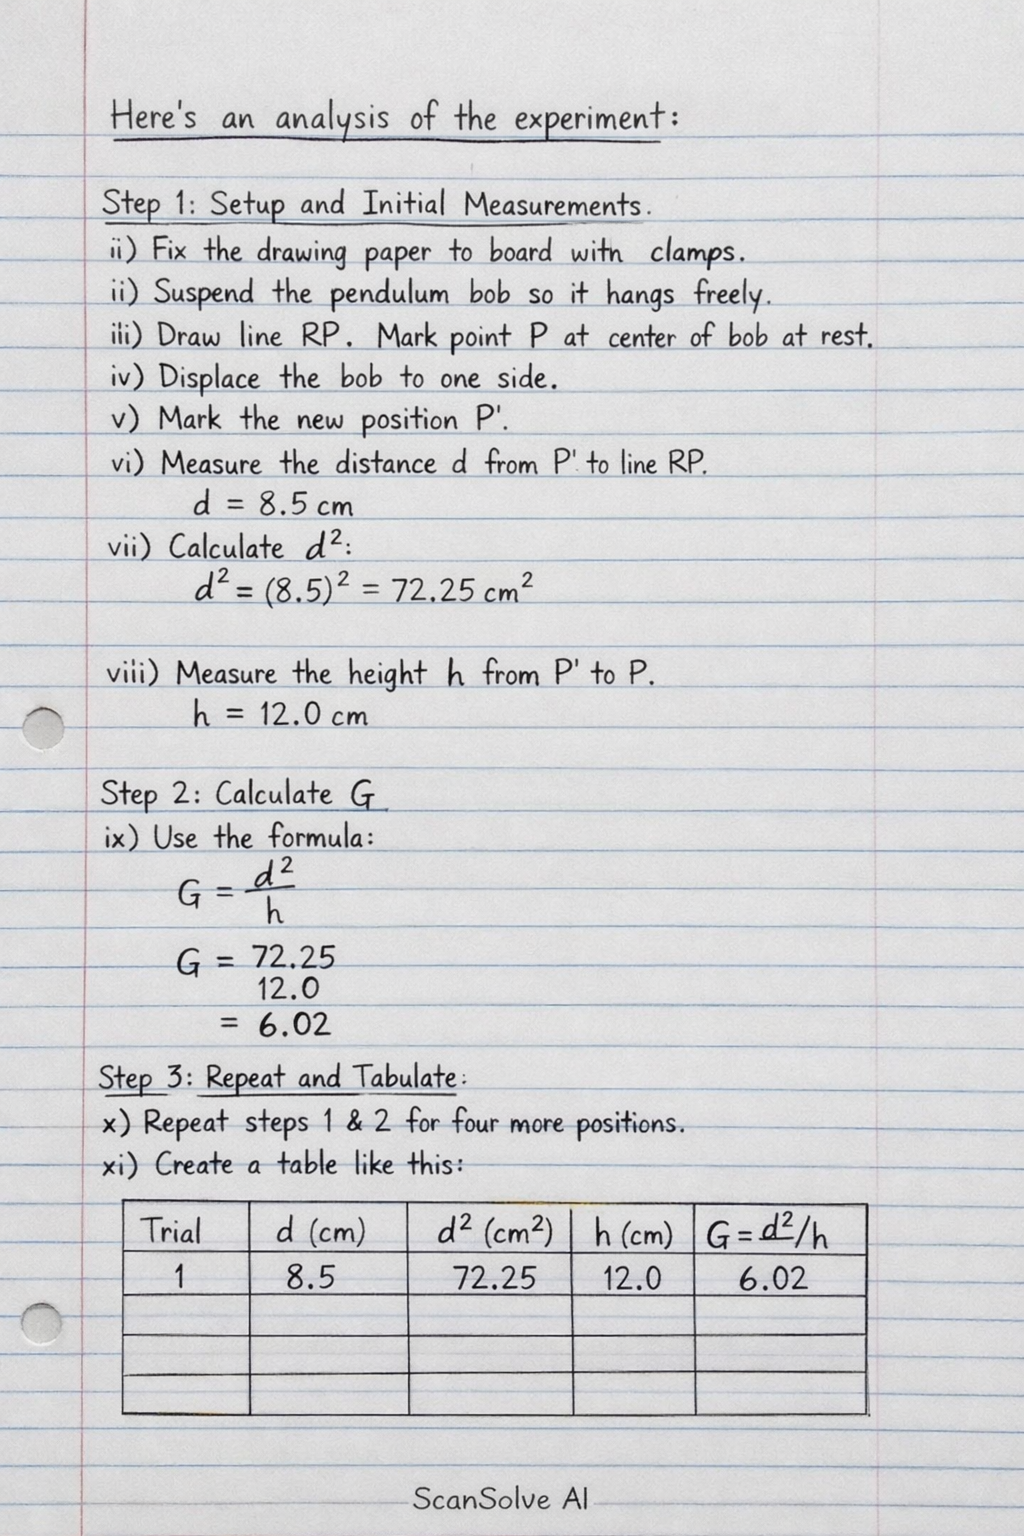
- vi) Measure and record the perpendicular distance, , of P' from the line RP.
- vii) Evaluate and record .
- viii) Measure and record the vertical height, , of P' above P.
Calculate G
- ix) Evaluate G using the formula:
Repeat and Tabulate
- x) Repeat the procedure in Step 1 and Step 2 for four other positions of P', obtaining different values for and .
- xi) Tabulate your readings in a table similar to this:
S/N (cm) (cm) (cm) (cm) 1 2 3 4 5 Determine Period T
- xii) Remove the drawing board so that the pendulum bob can swing freely.
- xiii) Set the pendulum bob oscillating through a small amplitude and determine the time, , for 20 complete oscillations using a stopwatch.
- xiv) Determine and record the period using the formula:
Plot Graph
- xv) Plot a graph with G on the vertical axis and on the horizontal axis, starting both axes from the origin . Draw the best-fit straight line through the plotted points.
Determine Intercept
- xvi) Determine the intercept on the vertical (G) axis from your graph.
Was this helpful?
Still stuck on this one?
Ask a follow-up, and the answer starts from this question.
Got a different question?Ask your own question
More Physics Questions
QComplete the table and determine the value of g from the given data on a simple pendulum.QWhat are the factors limiting accuracy in a simple pendulum experiment, and what are the…QThe period of oscillation of a simple pendulum is T = 2π√(l/g). The value of l is 20cm known to 1mm…QA simple pendulum 4 m long swings with an amplitude of 0.2m. Compute the velocity of the pendulum at…QDerive the formula for length of a simple pendulum
Browse by topic:Mechanics
Handwritten Step-by-Step Solution
Get this as a handwritten image on WhatsApp — like a tutor wrote it for you.
Try on WhatsApp