

This physics problem tests your understanding of fundamental physical laws and their applications. The step-by-step solution below breaks down the problem using relevant equations and physical reasoning.
ScanSolve AI Answer
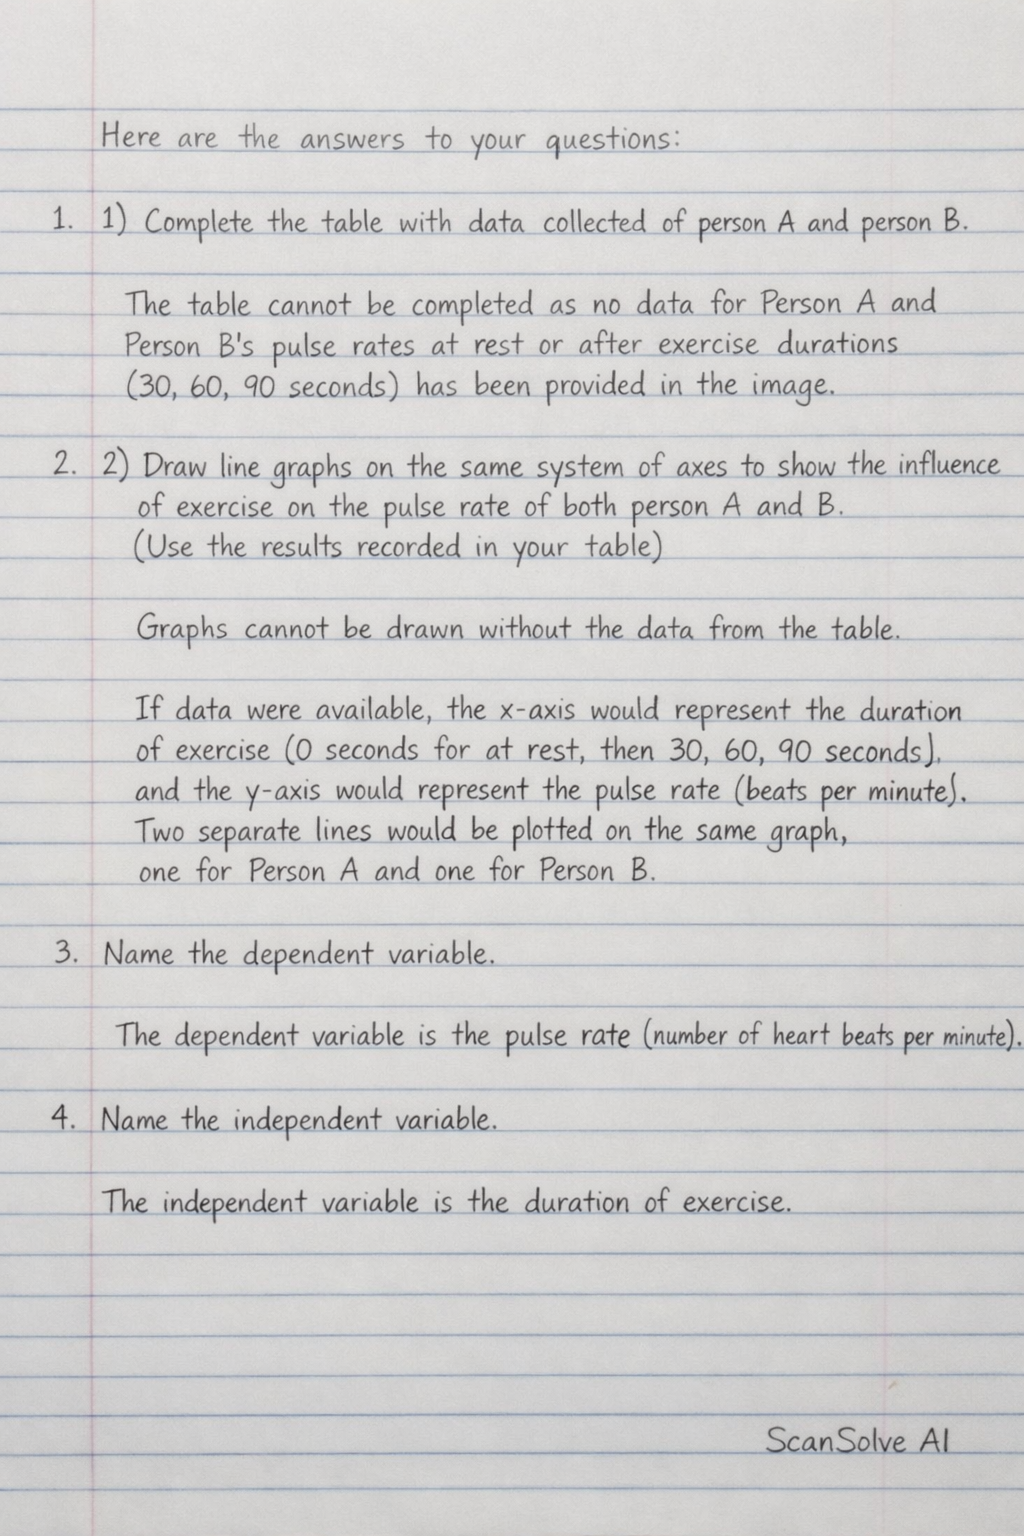
Here are the answers to your questions: 1. Complete the table with data collected of person A and person B. The table cannot be completed as no data for Person A and Person B's pulse rates at rest or after exercise durations (30, 60, 90 seconds) has been provided in the image. 2. Draw line graphs on the same system of axes to show the influence of exercise on the pulse rate of both person A and B. (Use the results recorded in your table) Graphs cannot be drawn without the data from the table. If data were available, the x-axis would represent the duration of exercise (0 seconds for at rest, then 30, 60, 90 seconds), and the y-axis would represent the pulse rate (beats per minute). Two separate lines would be plotted on the same graph, one for Person A and one for Person B. 3. Name the dependent variable. The dependent variable is the pulse rate (number of heart beats per minute). 4. Name the independent variable. The independent variable is the duration of exercise. 5. Name any TWO variables that you had to keep constant or controlled. Type of exercise (e.g., running in place) Intensity of exercise (e.g., same pace/effort) Environmental conditions (e.g., temperature, humidity) Time of day for the experiment Method of measuring pulse rate 6. What relationship exists between the dependent and independent variable? As the duration of exercise (independent variable) increases, the pulse rate (dependent variable) generally increases. 7. How could you increase the reliability of the experiment? Repeat the experiment multiple times and calculate an average pulse rate for each duration. Increase the number of participants (sample size). Ensure consistent and accurate pulse measurement techniques by all participants. 8. Provide THREE reasons why exercise is recommended for people. Improves cardiovascular health* by strengthening the heart and improving blood circulation. Helps manage weight* by burning calories and increasing metabolism. Strengthens muscles and bones*, reducing the risk of osteoporosis and injuries. Boosts mood and reduces stress* by releasing endorphins. Reduces the risk of chronic diseases* such as type 2 diabetes, certain cancers, and high blood pressure. 9. Compare the pulse rate of person A with that of person B. A comparison cannot be made without the specific pulse rate data for Person A and Person B. 10. State the conclusion for your investigation. The conclusion is that increasing the duration of exercise leads to an increase in a person's pulse rate.