
We read your photo as:
Copy the table and record your observations. Then draw a bar graph to show the distance elastic band moved when stretched at different distances. Use the graph sheet provided.
ScanSolve AI Answer
Here are the solutions for the remaining questions from your investigation:
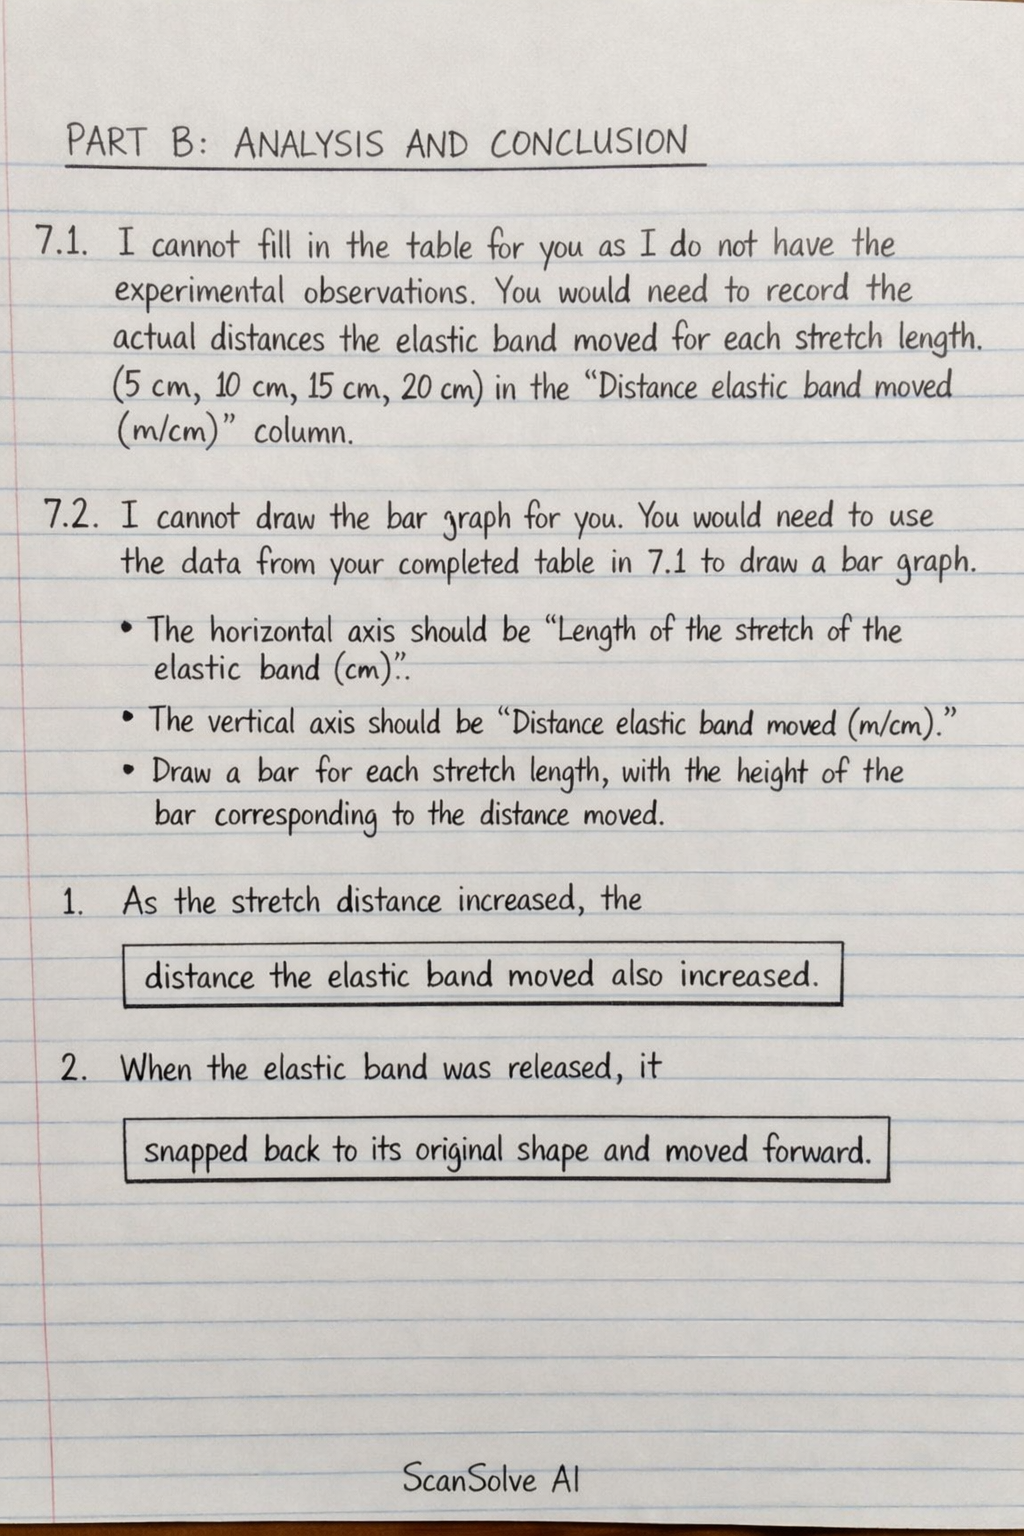
PART B: ANALYSIS AND CONCLUSION
7.1
I cannot fill in the table for you as I do not have the experimental observations. You would need to record the actual distances the elastic band moved for each stretch length (5 cm, 10 cm, 15 cm, 20 cm) in the "Distance elastic band moved (m/cm)" column.
7.2
I cannot draw the bar graph for you. You would need to use the data from your completed table in 7.1 to draw a bar graph.
- The horizontal axis should be "Length of the stretch of the elastic band (cm)".
- The vertical axis should be "Distance elastic band moved (m/cm)".
- Draw a bar for each stretch length, with the height of the bar corresponding to the distance moved.
1.
As the stretch distance increased, the .
2.
When the elastic band was released, it .
3.
The type of energy found in the elastic band when stretched was .
4.
The caused the greatest movement.
5.
Based on the expected results, I with my hypothesis.
6.
In conclusion, this investigation showed that
PART C: APPLICATION OF KNOWLEDGE
1.
This is like stretching an elastic band because
2.
When the mat returns to its original shape, it .
3.
Knowledge of elastic energy helps engineers design safety equipment by allowing them to
4.
You would use a stretching material to make sportswear because it
Still stuck on this one?
Ask a follow-up, and the answer starts from this question.
More Physics Questions
Handwritten Step-by-Step Solution
Get this as a handwritten image on WhatsApp — like a tutor wrote it for you.
Try on WhatsApp