
We read your photo as:
Interpret this graph showing the relationship between the period of oscillation and the angle of displacement.
Physics
ScanSolve AI Answer
This answer stops before the end.
It was cut off when it was first written. Ask ScanSolve this question again for the full working.
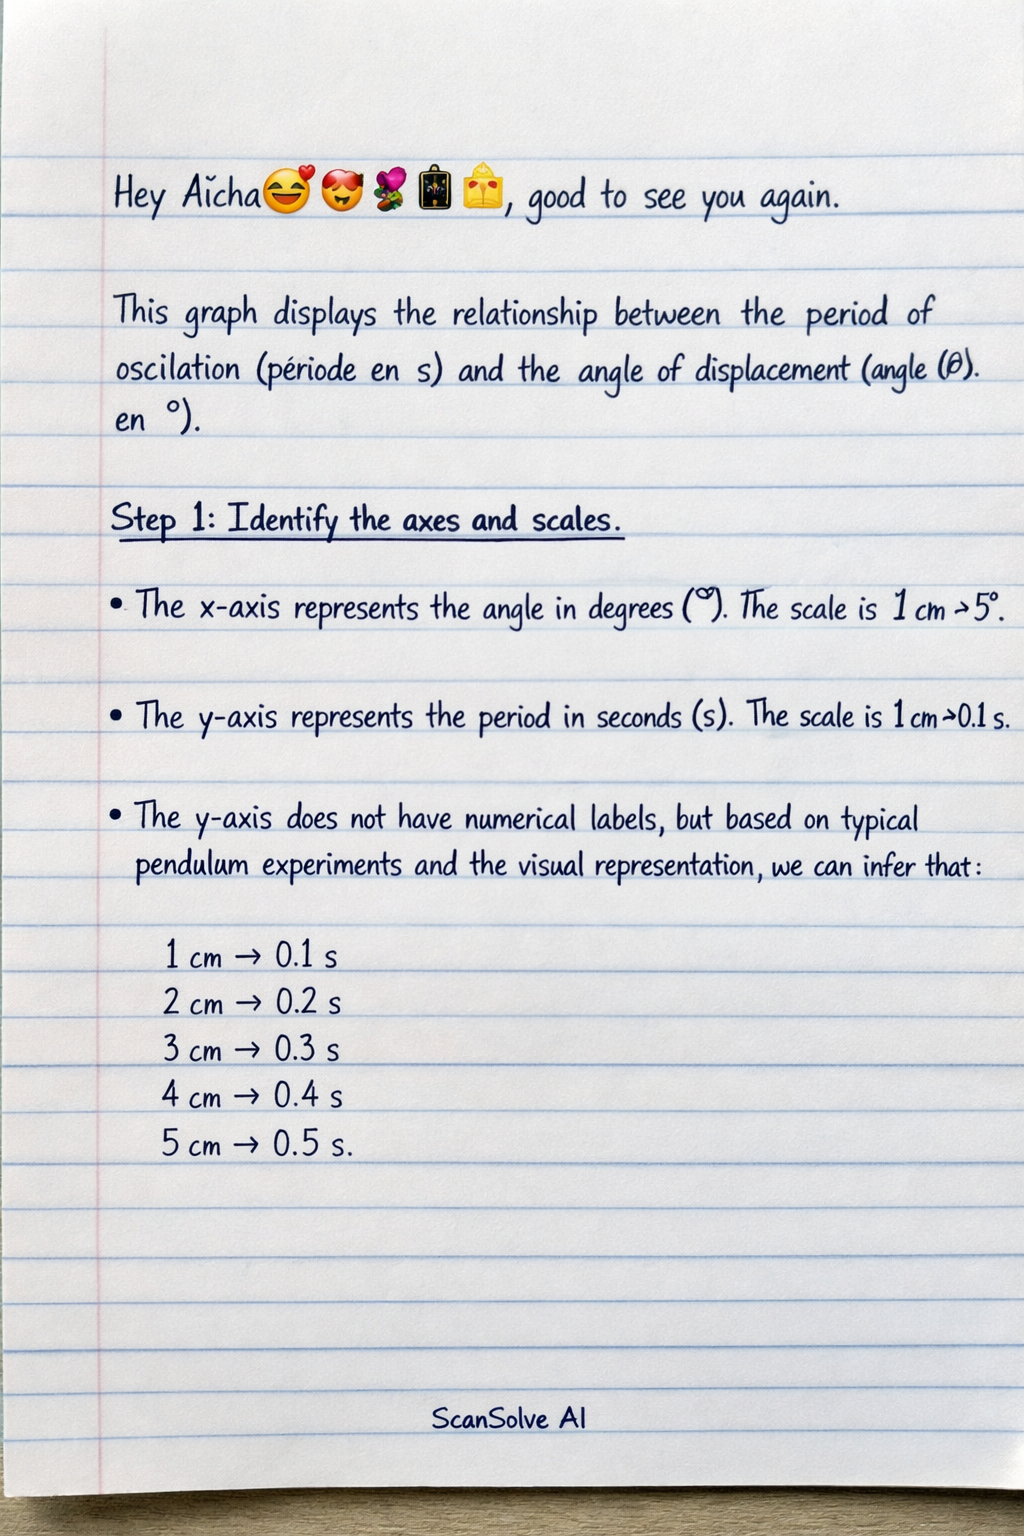
This graph displays the relationship between the period of oscillation (période en s) and the angle of displacement (angle (θ) en °).
Step 1: Identify the axes and scales.
- The x-axis represents the angle in degrees (). The scale is .
- The y-axis represents the period in seconds (s). The scale is .
- The y-axis does not have numerical labels, but based on typical pendulum experiments and the visual representation, we can infer that
Was this helpful?
Still stuck on this one?
Ask a follow-up, and the answer starts from this question.
Got a different question?Ask your own question
More Physics Questions
QDetermine the period of the pendulum.QGiven the following displacement – time graph for a mass oscillating on a spring. i. period ii. Find…QHow does the period of a pendulum change with amplitude, and what are the approximate period values…QUsing the provided graph, determine the relationship between the square of the period and the mass…QDescribe the Doppler Effect and calculate the period and frequency of a detected wave from a given…
Browse by topic:Mechanics
Handwritten Step-by-Step Solution
Get this as a handwritten image on WhatsApp — like a tutor wrote it for you.
Try on WhatsApp