
We read your photo as:
Outline a practical experiment to investigate the relationship between the displacement of a pendulum bob and its vertical height, and to determine the period of oscillation.
ScanSolve AI Answer
Step-by-step solution
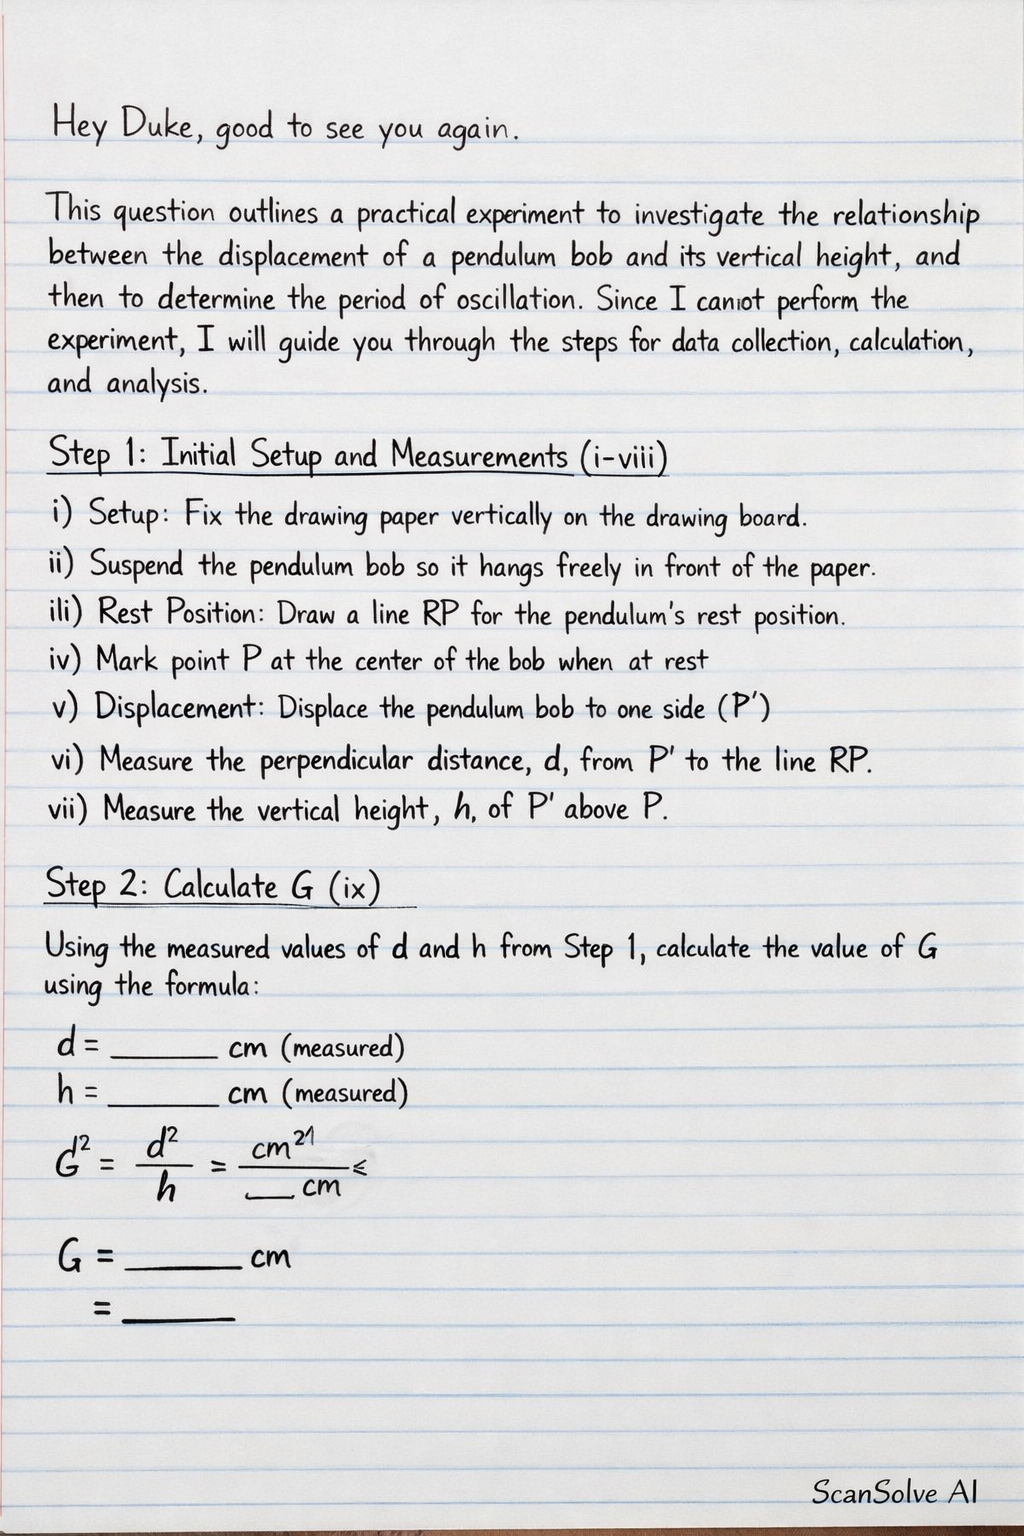
6 stepsThis question outlines a practical experiment to investigate the relationship between the displacement of a pendulum bob and its vertical height, and then to determine the period of oscillation. Since I cannot perform the experiment, I will guide you through the steps for data collection, calculation, and analysis.
Initial Setup and Measurements (i-viii)
- Setup: Fix the drawing paper vertically on the drawing board using clamps. Suspend the pendulum bob so it hangs freely in front of the paper.
- Rest Position: Draw a line RP representing the rest position of the pendulum string. Mark point P at the center of the bob when it's at rest.
- Displacement: Displace the pendulum bob to one side (P').
- Measurements: Measure the perpendicular distance, , from P' to the line RP. Measure the vertical height, , of P' above P.
Calculate G (ix)
Using the measured values of and from Step 1, calculate the value of G using the given formula:
Repeating Measurements and Tabulation (x-xi)
Repeat Step 1 and Step 2 for at least four other positions of P', meaning you should vary the displacement of the pendulum bob to obtain different values of and . Record all your readings in a table. A suitable table format is:
S/N (cm) (cm) (cm) (cm) 1 2 3 4 5 Determining the Period T (xii-xiv)
- Oscillation: Remove the drawing board. Set the pendulum bob oscillating through a small amplitude.
- Time Measurement: Use a stopwatch to determine the time, , for 20 complete oscillations.
- Period Calculation: Calculate the period, , of the pendulum using the formula:
Plotting the Graph (xv)
Plot a graph with the calculated values of G on the vertical axis and the corresponding values of h on the horizontal axis.
- Choose appropriate scales for both axes, ensuring they start from the origin (0,0).
- Plot the points (h, G) from your table.
- Draw the best-fit straight line through the plotted points.
Determining the Intercept (xvi)
From the graph plotted in Step 5, determine the intercept on the vertical (G) axis. This is the value of G where the best-fit line crosses the G-axis (i.e., when ).
Still stuck on this one?
Ask a follow-up, and the answer starts from this question.
More Physics Questions
Handwritten Step-by-Step Solution
Get this as a handwritten image on WhatsApp — like a tutor wrote it for you.
Try on WhatsApp