
We read your photo as:
The graph below shows the percentage of electrical energy lost during transmission over different distances. 3.1 What percentage of energy is lost when electricity is transmitted over 150 km? (1) 3.2 Describe the trend shown by the graph. (2) 3.3 Define load shedding. (2)
ScanSolve AI Answer
Answer
Step-by-step solution
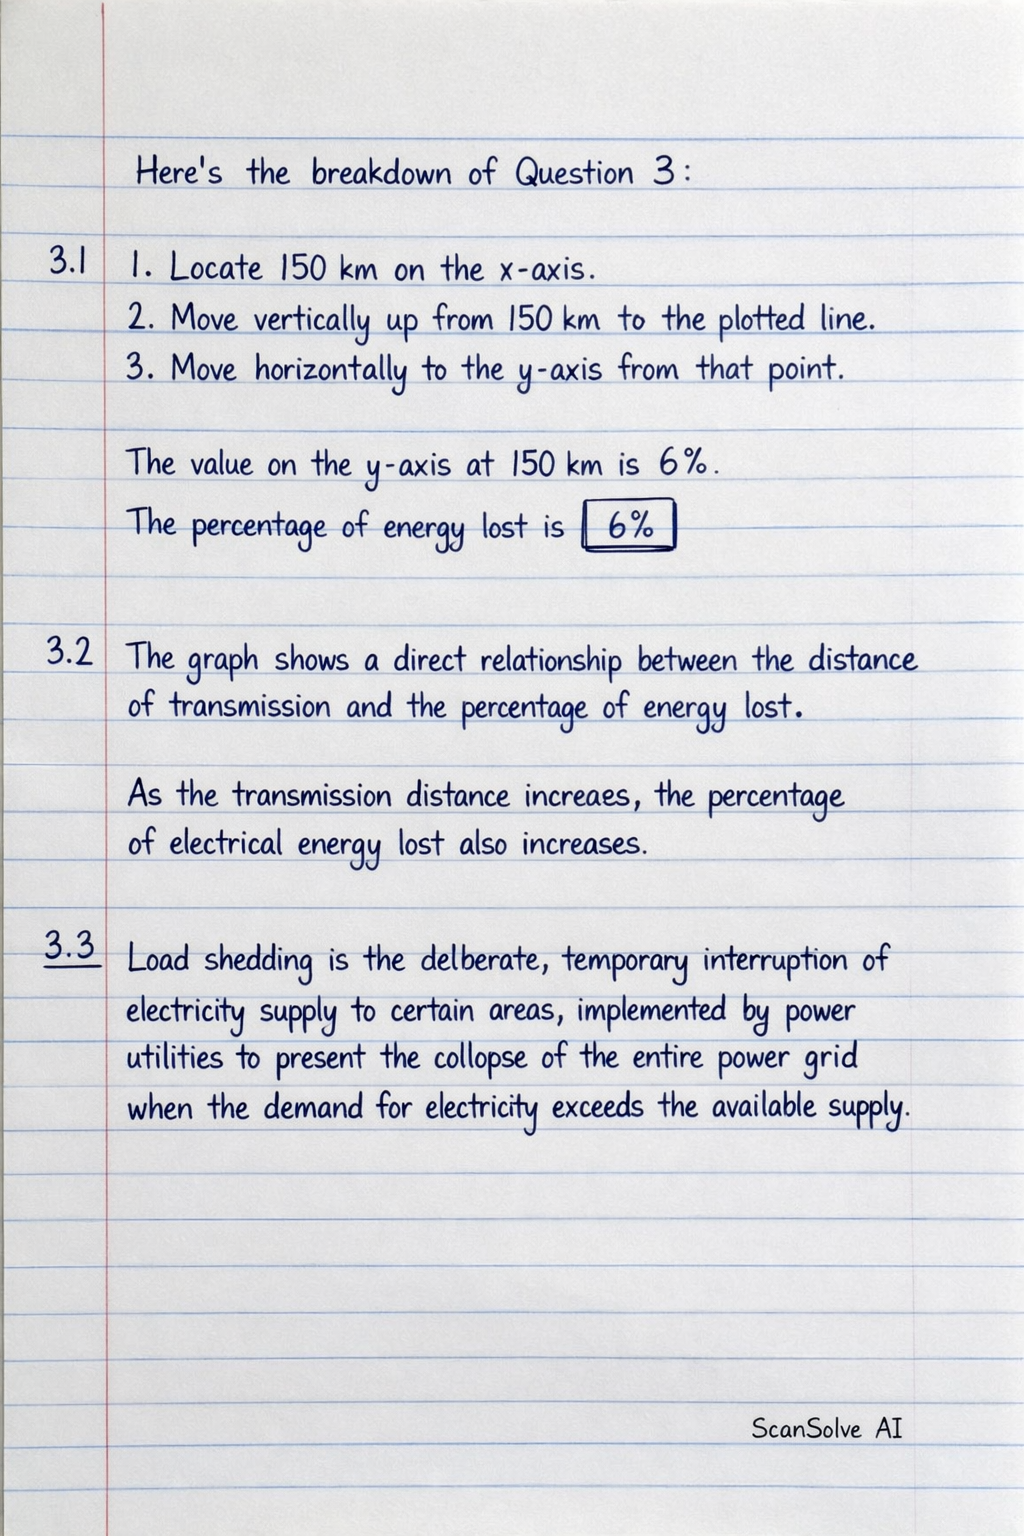
3 stepsHere's the breakdown of Question 3:
Part 3.1· 3 steps
Locate on the x-axis (Distance).
Move vertically up from to the plotted line on the graph.
Move horizontally from that point on the line to the y-axis (Percentage Energy Lost).
The value on the y-axis corresponding to is .
The percentage of energy lost is .
Part 3.2
The graph shows a direct relationship between the distance of transmission and the percentage of energy lost. As the transmission distance increases, the percentage of electrical energy lost also increases.
Part 3.3
Load shedding is the deliberate, temporary interruption of electricity supply to certain areas, implemented by power utilities to prevent the collapse of the entire power grid when the demand for electricity exceeds the available supply.
Try one yourself
A new problem that tests the same skill.
Still stuck on this one?
Ask a follow-up, and the answer starts from this question.
More Physics Questions
Handwritten Step-by-Step Solution
Get this as a handwritten image on WhatsApp — like a tutor wrote it for you.
Try on WhatsApp