
This mathematics problem involves applying core mathematical principles and formulas. Below you will find a complete step-by-step solution with detailed explanations for each step, helping you understand not just the answer but the method behind it.
ScanSolve AI Answer
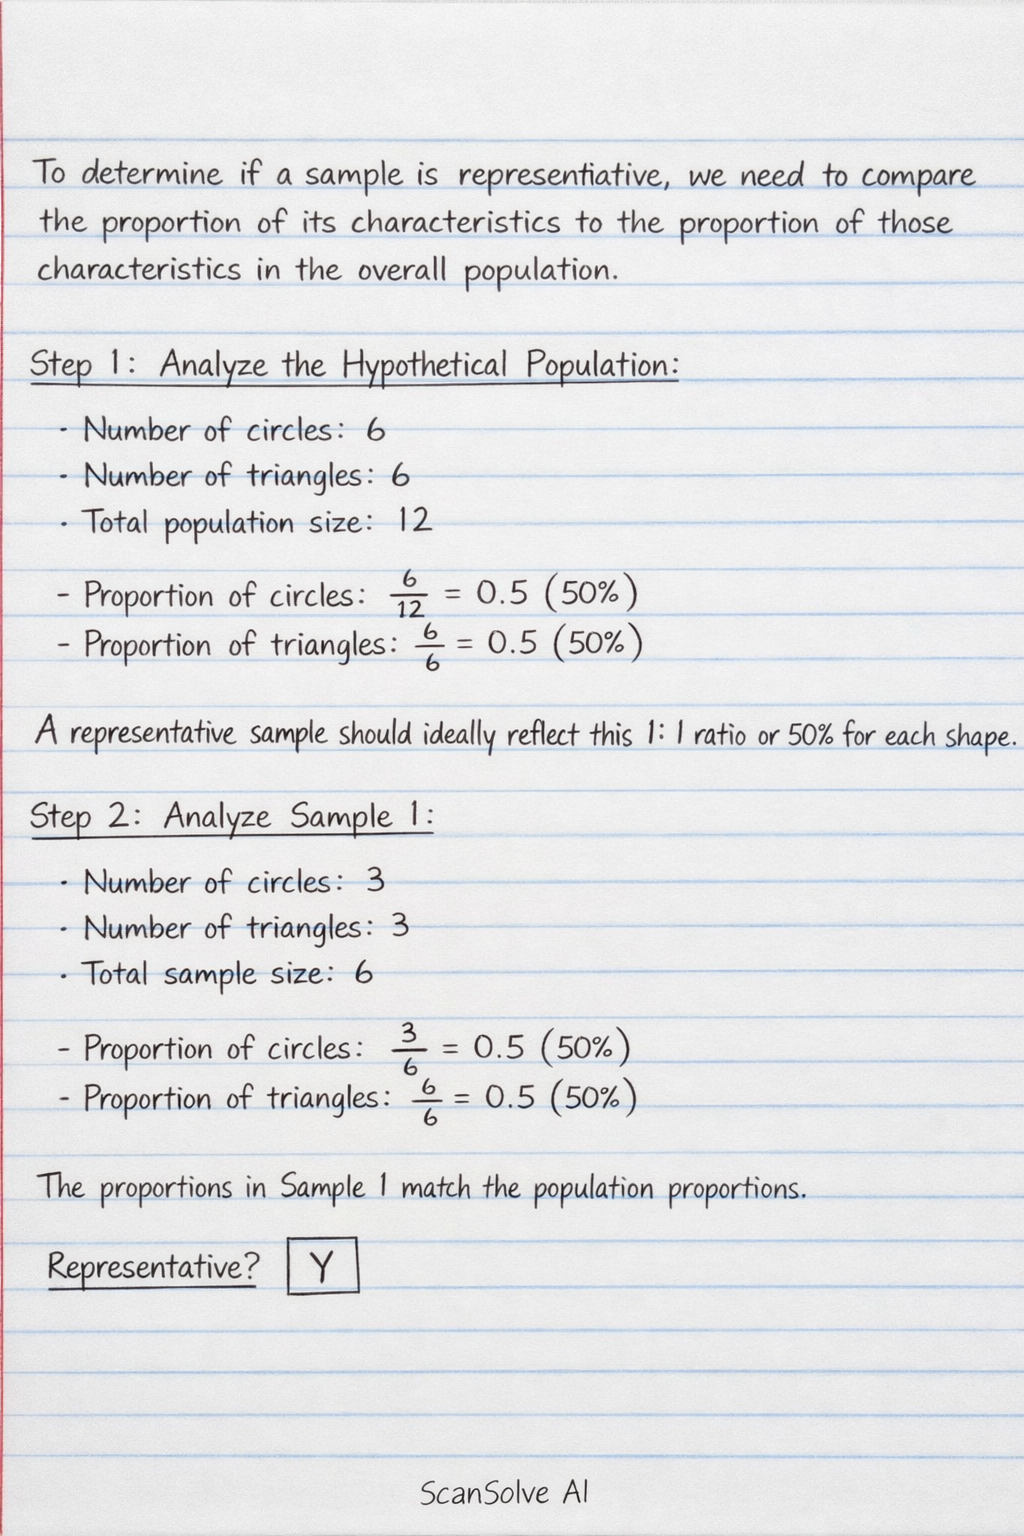
To determine if a sample is representative, we need to compare the proportion of its characteristics to the proportion of those characteristics in the overall population. Step 1: Analyze the Hypothetical Population. The population consists of circles (•) and triangles (▲). Number of circles: 6 Number of triangles: 6 Total population size: 12 Proportion of circles: (6)/(12) = 0.5 (50%) Proportion of triangles: (6)/(12) = 0.5 (50%) A representative sample should ideally reflect this 1:1 ratio or 50% for each shape. Step 2: Analyze Sample 1. Number of circles: 3 Number of triangles: 3 Total sample size: 6 Proportion of circles: (3)/(6) = 0.5 (50%) Proportion of triangles: (3)/(6) = 0.5 (50%) The proportions in Sample 1 match the population proportions. Representative? Y Step 3: Analyze Sample 2. Number of circles: 4 Number of triangles: 2 Total sample size: 6 Proportion of circles: (4)/(6) = (2)/(3) ≈ 0.67 (67%) Proportion of triangles: (2)/(6) = (1)/(3) ≈ 0.33 (33%) The proportions in Sample 2 (67% circles, 33% triangles) do not match the population proportions (50% circles, 50% triangles). Representative? N Step 4: Analyze Sample 3. Number of circles: 3 Number of triangles: 3 Total sample size: 6 Proportion of circles: (3)/(6) = 0.5 (50%) Proportion of triangles: (3)/(6) = 0.5 (50%) The proportions in Sample 3 match the population proportions. Representative? Y