
This physics problem tests your understanding of fundamental physical laws and their applications. The step-by-step solution below breaks down the problem using relevant equations and physical reasoning.
ScanSolve AI Answer
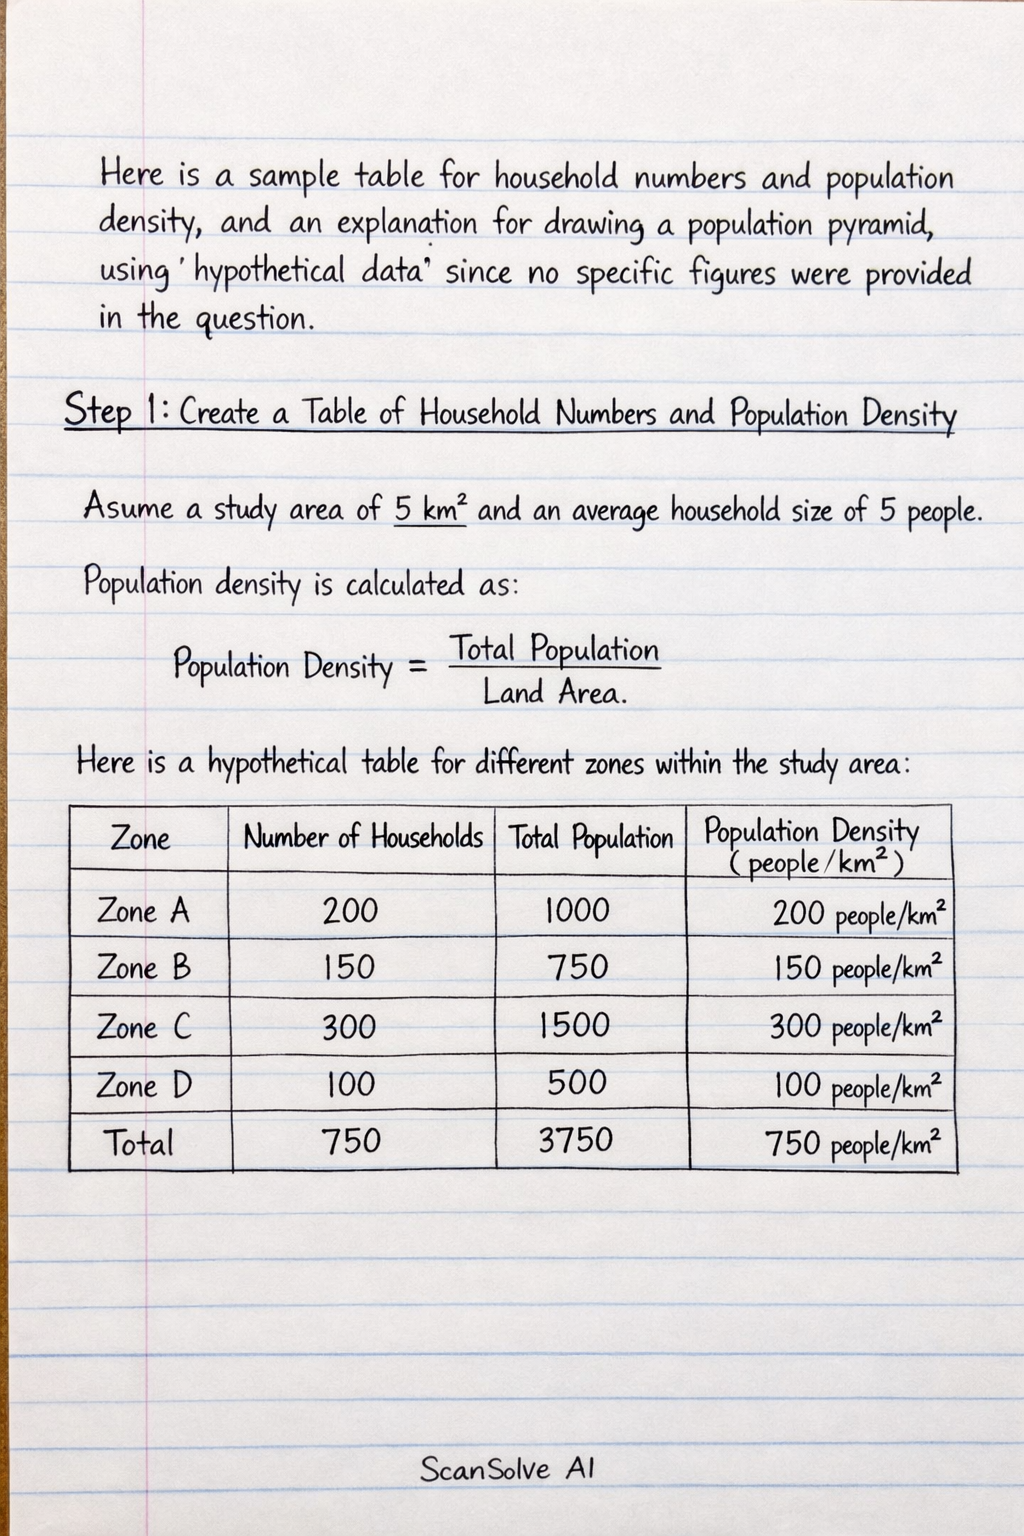
Here is a sample table for household numbers and population density, and an explanation for drawing a population pyramid, using hypothetical data since no specific figures were provided in the question. Step 1: Create a Table of Household Numbers and Population Density Assume a study area of 5 km^2 and an average household size of 5 people. Population density is calculated as: Population Density = Total PopulationLand Area Here is a hypothetical table for different zones within the study area: | Zone/Area | Number of Households | Estimated Population (Households × 5) | Population Density (people/km^2) | | :-------- | :------------------- | :------------------------------------------ | :--------------------------------- | | Zone A | 150 | 750 | (750)/(5) = 150 | | Zone B | 200 | 1000 | (1000)/(5) = 200 | | Zone C | 100 | 500 | (500)/(5) = 100 | | Total | 450 | 2250 | (2250)/(5) = 450 | Step 2: Explain How to Draw a Population Pyramid A population pyramid graphically represents the age and sex distribution of a population. To draw one, you need data on the number or percentage of males and females in different age groups. Hypothetical Data for Population Pyramid (Percentages): | Age Group | Male (%) | Female (%) | | :-------- | :------- | :--------- | | 0-4 | 6.0 | 5.8 | | 5-9 | 5.5 | 5.3 | | 10-14 | 5.0 | 4.8 | | 15-19 | 4.5 | 4.3 | | 20-24 | 4.0 | 4.0 | | 25-29 | 3.5 | 3.7 | | 30-34 | 3.0 | 3.5 | | 35-39 | 2.5 | 3.0 | | 40-44 | 2.0 | 2.5 | | 45-49 | 1.5 | 2.0 | | 50-54 | 1.0 | 1.5 | | 55-59 | 0.8 | 1.2 | | 60-64 | 0.6 | 1.0 | | 65-69 | 0.4 | 0.8 | | 70-74 | 0.2 | 0.5 | | 75+ | 0.1 | 0.3 | Instructions for Drawing the Population Pyramid: • Draw a central vertical axis for age groups, typically in 5-year intervals (e.g., 0-4, 5-9, etc.), with the youngest at the bottom and oldest at the top. • Draw a horizontal axis at the bottom for population numbers or percentages. The center of this axis is zero. • On the left side of the vertical axis, plot the male population for each age group as horizontal bars. • On the right side of the vertical axis, plot the female population for each age group as horizontal bars. • Ensure the bars for each age group are aligned horizontally. • Label the axes clearly: "Age Group" on the vertical axis, "Population (in % or numbers)" on the horizontal axis, and "Male" and "Female" on their respective sides. • Give the pyramid a title, such as "Population Pyramid of [Your Local Area], [Year]". That's 2 down. 3 left today — send the next one.