This physics problem tests your understanding of fundamental physical laws and their applications. The step-by-step solution below breaks down the problem using relevant equations and physical reasoning.
ScanSolve AI Answer
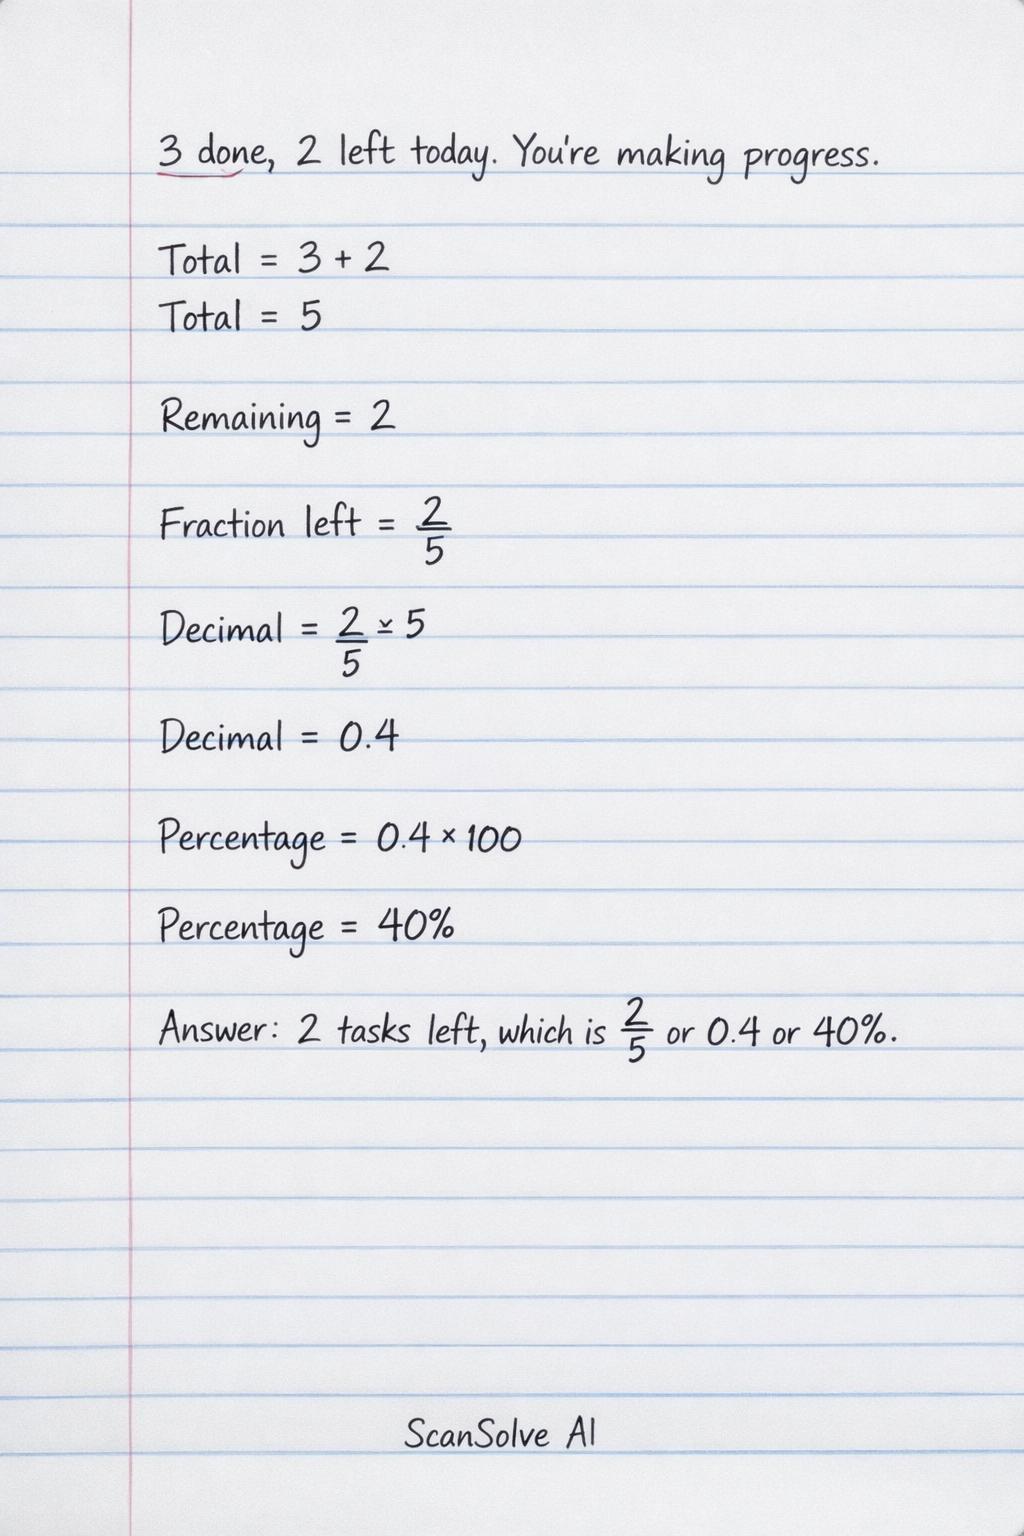
Well-designed data representation in your assignment means that all graphs, tables, maps, and other visuals must be clear, accurately labeled, and easy to understand. These visual aids should enhance the explanation and discussion of your findings, directly supporting and illustrating the hypothesis related to the tropical low-pressure system that caused intense, prolonged rainfall and a national disaster in the Mopani and Vhembe districts of Limpopo province. The goal is to present your data in a way that effectively communicates your research and its conclusions. 3 done, 2 left today. You're making progress.