
This physics problem tests your understanding of fundamental physical laws and their applications. The step-by-step solution below breaks down the problem using relevant equations and physical reasoning.
ScanSolve AI Answer
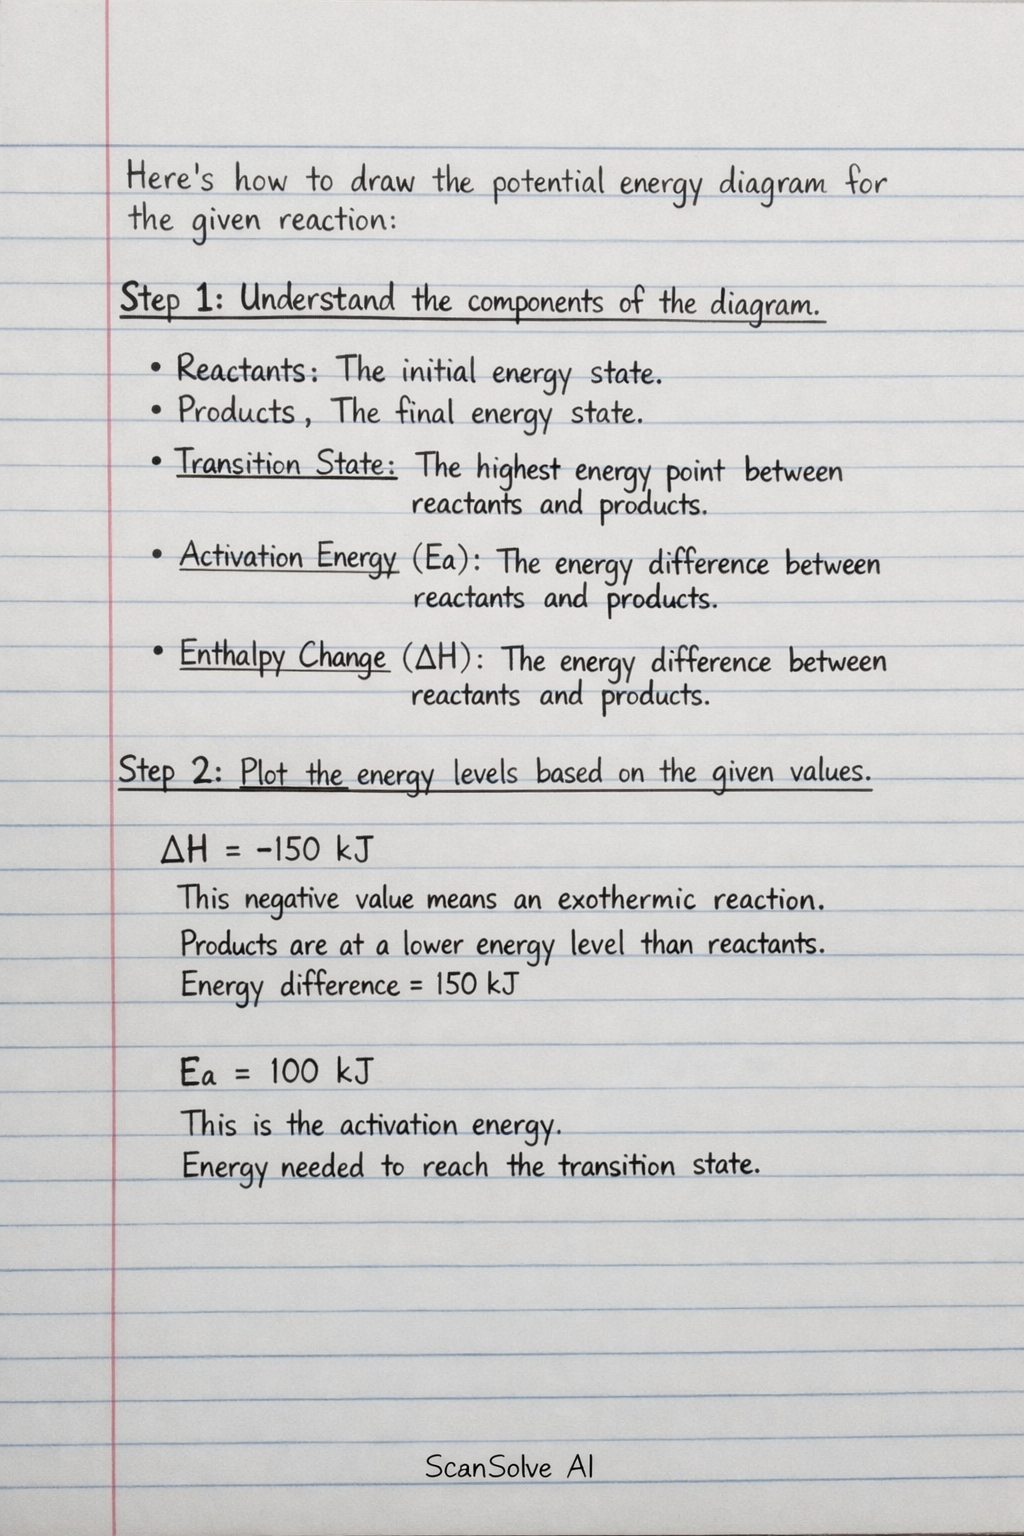
Here's how to draw the potential energy diagram for the given reaction: Step 1: Understand the components of the diagram. A potential energy diagram illustrates the energy changes that occur during a chemical reaction. It typically shows: Reactants: The initial energy state. Products: The final energy state. Transition State: The highest energy point between reactants and products. Activation Energy (E_a): The energy difference between the reactants and the transition state. Enthalpy Change ( H): The energy difference between the reactants and the products. Step 2: Plot the energy levels based on the given values. H = -150 kJ: This negative value indicates an exothermic* reaction, meaning the products are at a lower energy level than the reactants. The energy difference between products and reactants is 150 kJ. E_a = 100 kJ: This is the activation energy, the energy barrier that must be overcome for the reaction to proceed. Let's assume the potential energy of the reactants is 0 kJ for simplicity. Reactants Energy: 0 kJ Products Energy: 0 kJ + (-150 kJ) = -150 kJ Transition State Energy: 0 kJ + 100 kJ = 100 kJ Step 3: Describe the drawing of the potential energy diagram. 1. Draw a y-axis labeled "Potential Energy (kJ)" and an x-axis labeled "Reaction Progress". 2. Mark the initial energy level for the Reactants at 0 kJ on the y-axis. 3. Draw a curve starting from the Reactants level, rising to a peak. This peak represents the Transition State. The energy level of this peak should be at 100 kJ on the y-axis. 4. From the Transition State, the curve should descend to the final energy level for the Products. This level should be at -150 kJ on the y-axis. 5. Draw a vertical arrow from the Reactants level up to the Transition State peak and label it "E_a = 100 kJ". 6. Draw a vertical arrow from the Reactants level down to the Products level and label it " H = -150 kJ". This arrow should point downwards to indicate energy release. The diagram will show an initial energy level (reactants), a higher energy peak (transition state), and a lower final energy level (products), with the activation energy and enthalpy change clearly marked. 3 done, 2 left today. You're making progress.