
We read your photo as:
The POSITION-TIME GRAPH (not drawn to scale) for a cyclist initially moving west on a straight horizontal road is shown below: 1 Why does the position decrease after 60 seconds? 2 Calculate the velocity of the cyclist for the first 30 seconds.
ScanSolve AI Answer
Answers
3 partsStep-by-step solution
7 stepsHere are the solutions to Question 3.
Part 3.1
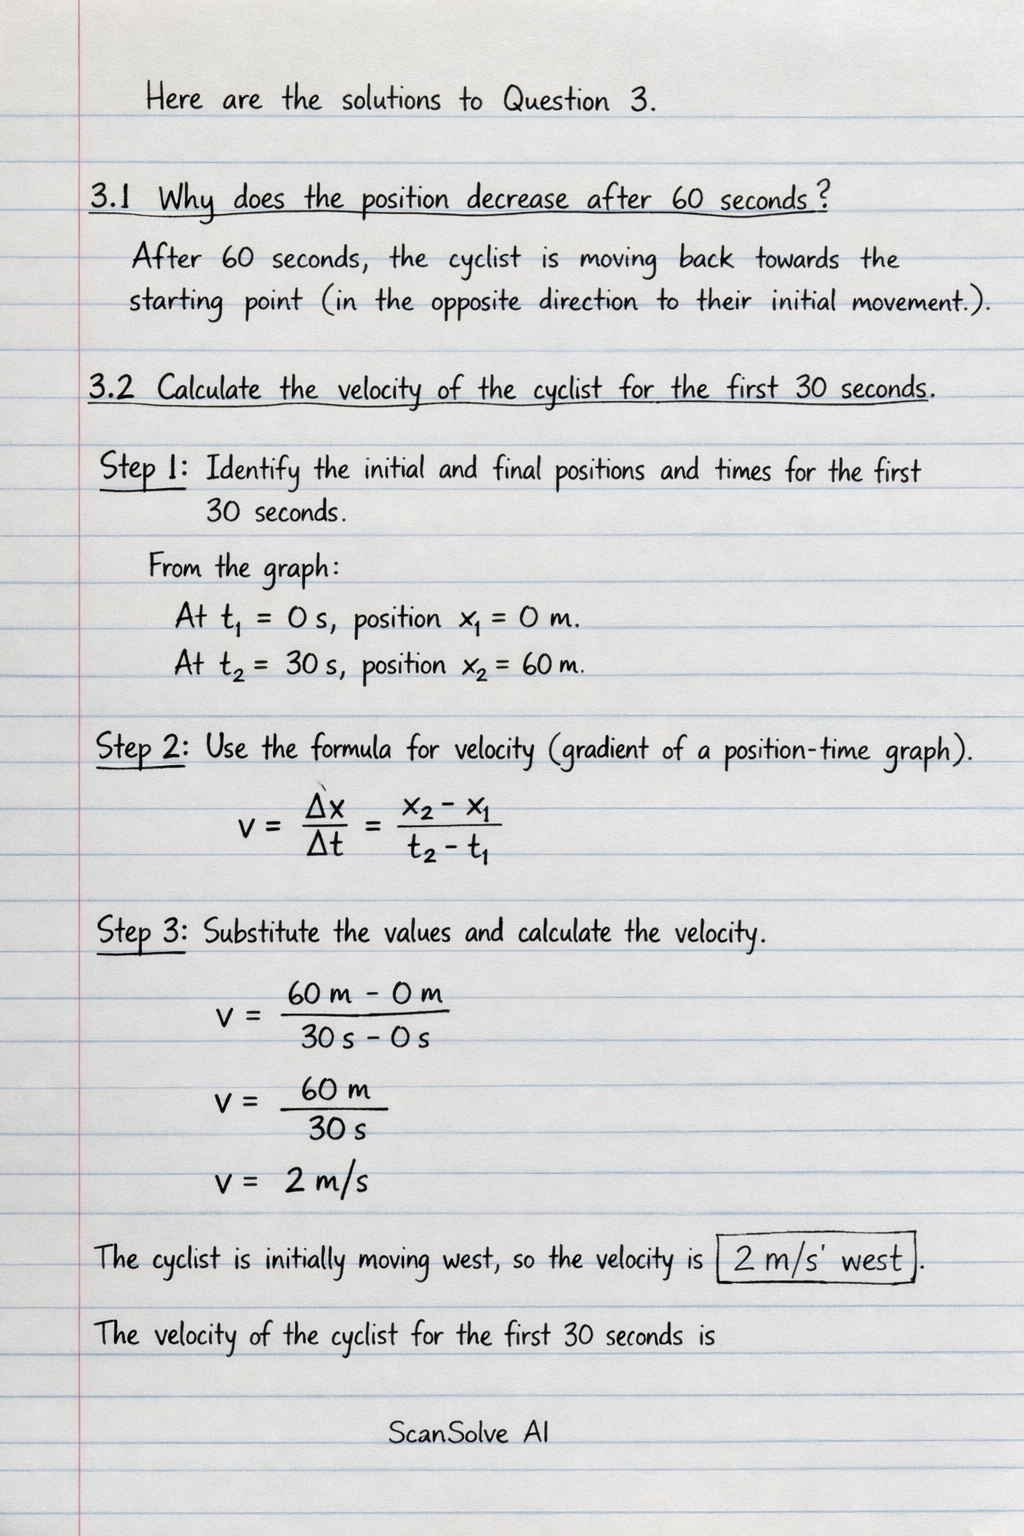
Why does the position decrease after 60 seconds?
After 60 seconds, the cyclist is moving back towards the starting point (or in the opposite direction to their initial movement).
Part 3.2
Calculate the velocity of the cyclist for the first 30 seconds.
Identify the initial and final positions and times for the first 30 seconds.
From the graph:
At s, position m.
At s, position m.Use the formula for velocity (gradient of a position-time graph).
Substitute the values and calculate the velocity.
The cyclist is initially moving west, so the velocity is west.
The velocity of the cyclist for the first 30 seconds is .
Part 3.3
Write down the acceleration of the cyclist for the first 30 seconds.
The acceleration of the cyclist for the first 30 seconds is .
Part 3.4
Explain the answer to QUESTION 3.3 referring to the shape of the graph.
For the first 30 seconds, the position-time graph is a straight line with a constant positive slope. A constant slope on a position-time graph indicates that the velocity is constant, and therefore the acceleration is zero.
Part 3.5
Determine the total distance covered by the cyclist for the entire 70 second period.
Calculate the distance covered in the first segment (0 to 30 seconds).
The position changes from 0 m to 60 m.
Distance.Calculate the distance covered in the second segment (30 to 60 seconds).
The position remains constant at 60 m.
Distance.Calculate the distance covered in the third segment (60 to 70 seconds).
Given that the magnitude of the velocity is and the time interval is .
Distance
Distance.Calculate the total distance covered.
Total distance = Distance + Distance + Distance
Total distance =
Total distance = .
The total distance covered by the cyclist for the entire 70 second period is .
Try one yourself
A new problem that tests the same skill.
Still stuck on this one?
Ask a follow-up, and the answer starts from this question.
More Physics Questions
Handwritten Step-by-Step Solution
Get this as a handwritten image on WhatsApp — like a tutor wrote it for you.
Try on WhatsApp