
We read your photo as:
Fig. 1.2 shows a sketch of a speed-time graph for the motion of another horse that also ran for 30 seconds. Describe the acceleration of the horse in the first 10 seconds.
ScanSolve AI Answer
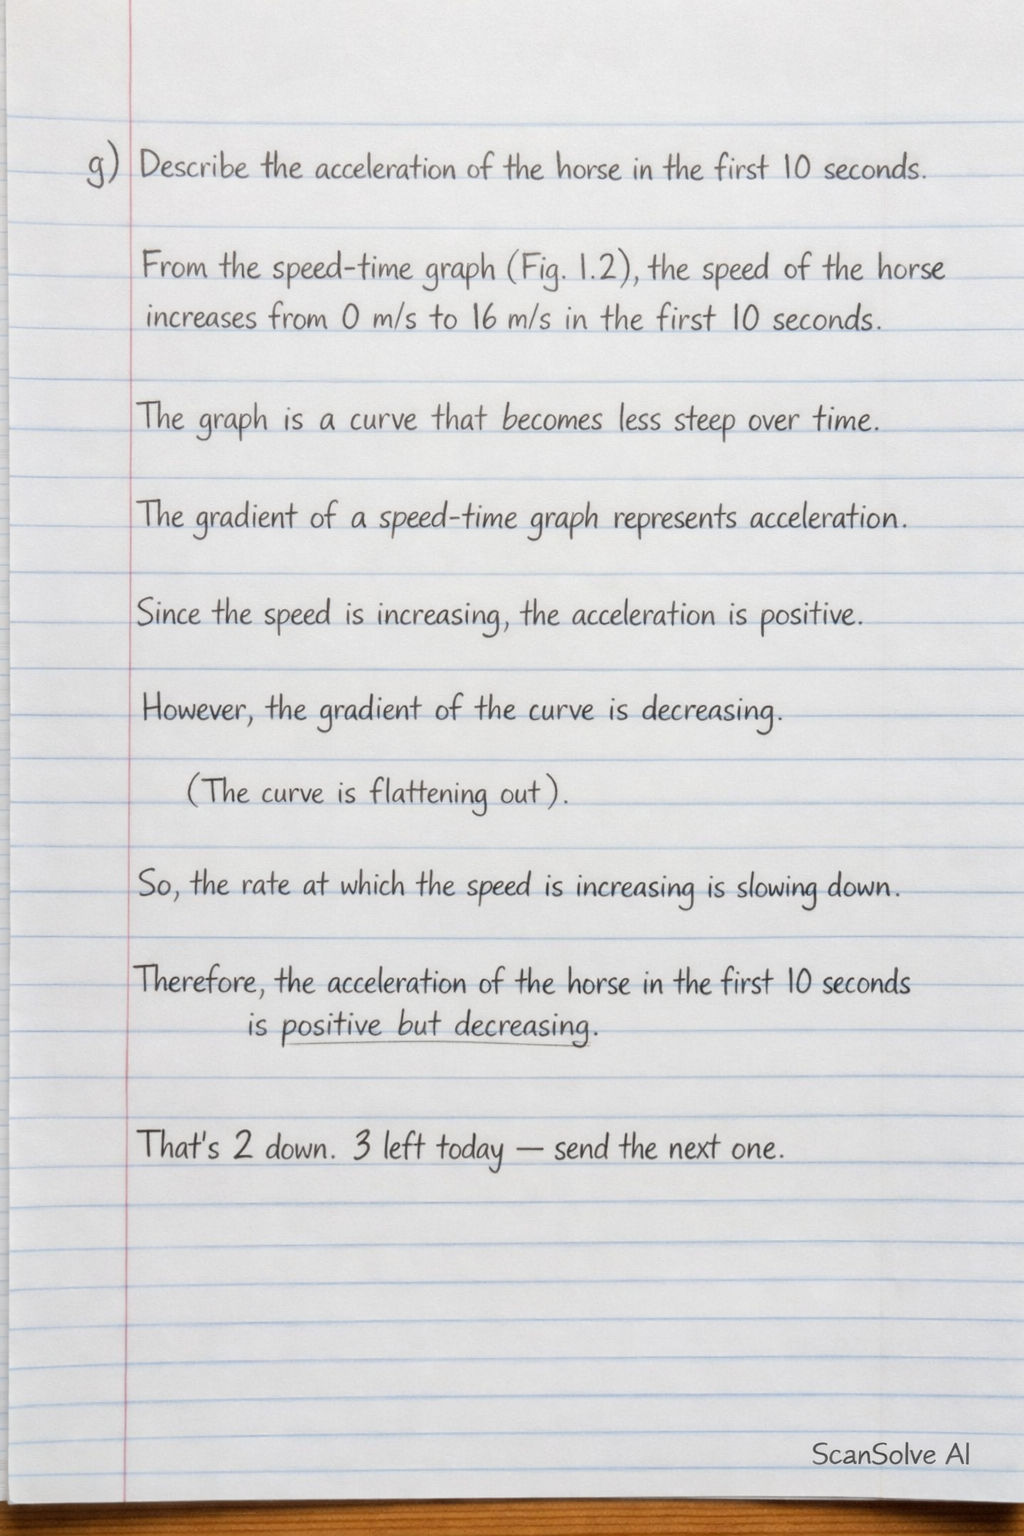
g) Describe the acceleration of the horse in the first 10 seconds.
From the speed-time graph (Fig. 1.2), the speed of the horse increases from to in the first 10 seconds. The graph is a curve that becomes less steep over time.
The gradient of a speed-time graph represents acceleration. Since the speed is increasing, the acceleration is positive. However, because the gradient of the curve is decreasing (the curve is flattening out), the rate at which the speed is increasing is slowing down.
Therefore, the acceleration of the horse in the first 10 seconds is positive but decreasing.
Still stuck on this one?
Ask a follow-up, and the answer starts from this question.
More Physics Questions
Handwritten Step-by-Step Solution
Get this as a handwritten image on WhatsApp — like a tutor wrote it for you.
Try on WhatsApp