
We read your photo as:
Construct the demand and supply curve for kaukau in the grid below. Label the graph correctly.
ScanSolve AI Answer
Answer
Step-by-step solution
4 stepsPart a· 4 steps
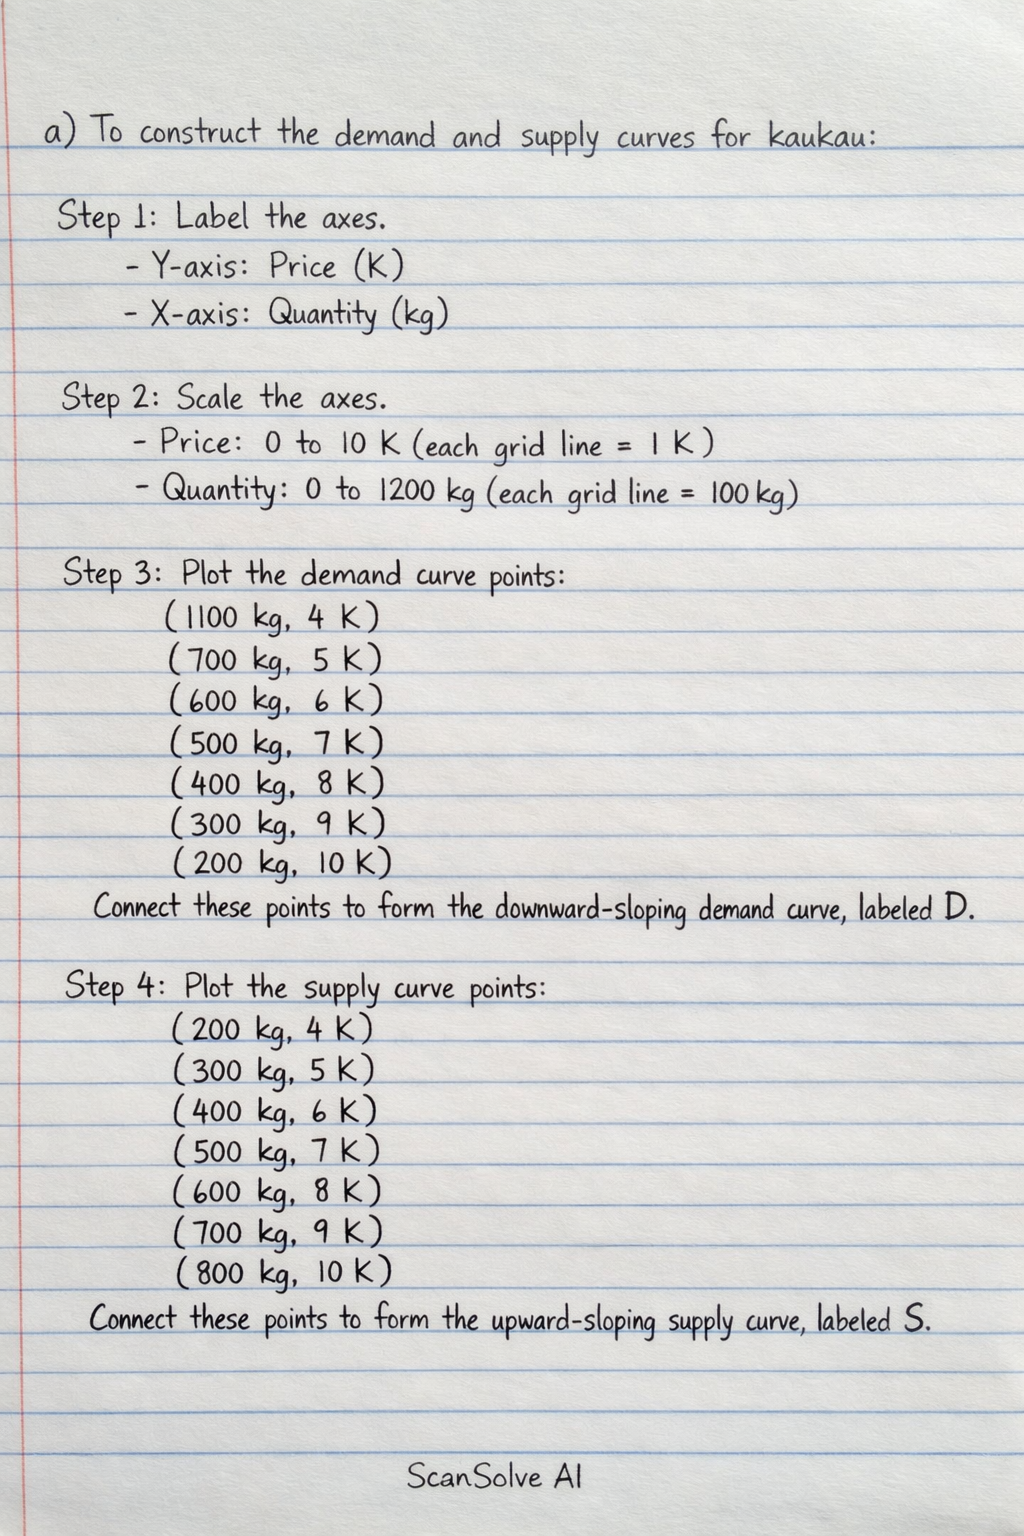
To construct the demand and supply curves for kaukau
Label the axes.
The vertical axis (y-axis) should be labeled "Price (K)" and the horizontal axis (x-axis) should be labeled "Quantity (kg)".
Scale the axes.
- For the Price axis, you can label from 0 to 10 K, with each grid line representing 1 K.
- For the Quantity axis, you can label from 0 to 1200 kg, with each grid line representing 100 kg or 200 kg, depending on the number of grid lines available.
Plot the demand curve points.
These points are (Quantity Demanded, Price):
(1100 kg, 4 K), (700 kg, 5 K), (600 kg, 6 K), (500 kg, 7 K), (400 kg, 8 K), (300 kg, 9 K), (200 kg, 10 K).
Connect these points to form the downward-sloping demand curve, labeled .Plot the supply curve points.
These points are (Quantity Supplied, Price):
(200 kg, 4 K), (300 kg, 5 K), (400 kg, 6 K), (500 kg, 7 K), (600 kg, 8 K), (700 kg, 9 K), (800 kg, 10 K).
Connect these points to form the upward-sloping supply curve, labeled .The graph should look similar to this representation:
\begin{tikzpicture}
    % Axes
    \draw[->] (0,0) -- (0,5) node[left] {Price (K)};
    \draw[->] (0,0) -- (6,0) node[below] {Quantity (kg)};

    % Demand Curve
    \draw[blue, thick] (0.5,4.5) node[above left] {$D$} -- (5.5,0.5);
    % Supply Curve
    \draw[red, thick] (0.5,0.5) node[below right] {$S$} -- (5.5,4.5);

    % Equilibrium Point
    \fill[black] (3,2.5) circle (1.5pt) node[above right] {Equilibrium};
    \draw[dashed] (0,2.5) -- (3,2.5) node[left] {7};
    \draw[dashed] (3,0) -- (3,2.5) node[below] {500};
\end{tikzpicture}
Part b
The market price is the price at which the quantity demanded equals the quantity supplied.
From the table:
At a price of 7 K, the quantity supplied is 500 kg and the quantity demanded is 500 kg.
The market price is 7 K. This is the equilibrium price where the quantity of kaukau that consumers are willing and able to buy (500 kg) exactly matches the quantity that producers are willing and able to sell (500 kg). At this price, there is no surplus or shortage in the market.
Try one yourself
A new problem that tests the same skill.
Still stuck on this one?
Ask a follow-up, and the answer starts from this question.
More Economics Questions
Handwritten Step-by-Step Solution
Get this as a handwritten image on WhatsApp — like a tutor wrote it for you.
Try on WhatsApp